


Published on July 2, 2025
13 min to read
LinkedIn Analytics: Complete Guide [w/ metrics, tools, etc.]

Summarize with AI

![LinkedIn Analytics: Complete Guide [w/ metrics, tools, etc.]](/static/489af1a87341dc6462cc1f5f80696f27/40476/Linkedin-analytics.jpg "LinkedIn Analytics: Complete Guide [w/ metrics, tools, etc.]")
Table of contents
Summarize with AI

ChatGPT

Claude

Perplexity
Share

Vista Social

X (Twitter)


LinkedIn Analytics can feel like a maze, especially when trying to prove the value of your efforts to your clients.
The good news is that there are tips, tricks, and tools to unravel the “mystery” of analyzing LinkedIn data.
Whether you’re tracking your clients’ company page growth, engagement metrics, or lead generation performance, knowing how to decode LinkedIn Analytics is key to showing real results—and leveling up your strategy.
In this complete guide, we’ll break it all down: the metrics that matter, the tools that make your life easier, and how to turn data into action without drowning in spreadsheets.
No jargon.
No fluff.
Just practical, tried and true tips to make LinkedIn work for you and your clients.
Ready to go from guessing to growing?
Let’s dive in.
Table of contents
What you will learn
- What is LinkedIn analytics?
- Why does LinkedIn analytics matter?
- What are the most important metrics to track with LinkedIn analytics?
- Top tools for effective LinkedIn analytics
- 7 Tips to get the most out of your LinkedIn Analytics data
- What you can get wrong with LinkedIn Analytics
- FAQs on LinkedIn Analytics
- Turn LinkedIn analytics insights into impact
What is LinkedIn analytics?
LinkedIn Analytics is the built-in insights tool that helps you measure how your content, company page, and audience perform on LinkedIn.
Think of it as your backstage pass to understanding what’s working (and what’s not) on one of the most powerful professional social media platforms.
For social media managers, LinkedIn analytics can be your go-to dashboard for proving Return on Investment (ROI) to clients running campaigns on the platform.
It can also give you actionable insights to refine your content strategy and spot new opportunities to grow your clients’ brand presence on LinkedIn.
Why does LinkedIn analytics matter?
LinkedIn analytics is vital because flying blind on the platform isn’t a sound strategy.
If you’re putting effort into your clients’ content, growing their pages, or trying to boost their brand visibility, LinkedIn Analytics is your best friend for figuring out what’s actually moving the needle.
Below are several things that LinkedIn analytics can help you do.
- Track content performance. LinkedIn Analytics can help you see which posts generate clicks, shares, and engagement, so you can double down on what works
- Understand your target audience. With LinkedIn analytics, you can get insights into who’s viewing your clients’ content (job titles, industries, locations, and more). You can leverage this post analytics data to tailor content accordingly and create posts that resonate and drive engagement
- Measure follower growth. LinkedIn analytics can help you determine if your clients’ pages attract the right people, such as potential clients, and if your strategy is paying off
Must read: How to Find Clients on LinkedIn (A Guide for Agencies)
- Improve content strategy. LinkedIn analytics data can give you key insights to refine your posting schedule, content formats, and messaging to boost engagement and conversions
- Prove ROI. LinkedIn analytics can help you uncover and show real results from your LinkedIn efforts when it’s time to report back to your team or client
What are the most important metrics to track with LinkedIn analytics?
While LinkedIn offers a ton of metrics, not all of them carry equal weight.
Below are some key metrics to keep an eye on, especially if you’re trying to prove ROI, refine your strategy, or demonstrate value to your clients.
Engagement rate
Engagement rate measures the number of people who interacted with your clients’ LinkedIn content (likes, comments, shares, and clicks) compared to the total number of views.
The metric goes beyond surface-level popularity since it shows whether your content actually connects with your clients’ audiences.
A strong engagement rate often signals that your clients’ messaging, timing, and visuals are on point.
Click through rate
Click-Through Rate (CTR) is all about action.
It tells you the percentage of viewers who clicked your link after seeing a post.
Whether you’re driving traffic to a landing page, product, or blog post, a high CTR means your Call-to-Action (CTA) and content are doing their job.
If CTR is low, it may be time to tweak your wording or CTA placement.
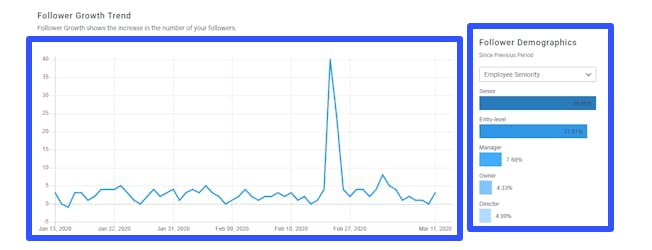
Follower Growth
Follower count isn’t everything, but the trend line matters.
Tracking your clients’ follower growth on LinkedIn helps you see if your strategy is attracting the right audience over time.
A steady climb signals healthy momentum.
However, sudden drops can be a red flag, and you’ll need to revisit your recent content tone or topics to check on gaps.
Audience demographics
The audience demographics metric shows you the breakdown of your clients’ followers by job title, industry, company size, location, and more.
The metric is incredibly useful for targeting.
For example, if you’re trying to reach HR professionals in tech, this data confirms whether you’re getting your clients’ content and brands in front of the right audience or if you need to shift your approach. Using a LinkedIn contact finder can help you directly identify and connect with the specific professionals you want to target, making your outreach more precise and effective.
Page views and button clicks
LinkedIn Company Page insights show how often users visit your clients’ profiles and click key buttons such as “Visit Website” or “Contact Us.”
Must read: LinkedIn SEO: Steps to Proven to Optimize Your Profile
If these LinkedIn page analytics numbers are strong, it can mean that your clients’ content is driving interest in their brands beyond their feeds, potentially leading to conversions or inquiries.
Top performing posts
Reviewing your clients’ top posts helps you reverse-engineer success.
You’ll know which of your clients’ LinkedIn posts got the most engagement, reach, or clicks, whether they were carousels, polls, or videos, and which topics resonated best.
You can use these insights to guide your future content decisions and keep building on what’s working for your efforts and clients.
Post timing and frequency metrics
When and how often you post can significantly impact your results on LinkedIn.
LinkedIn analytics can help you pinpoint what days and times generate the most engagement, and whether posting more often actually benefits your clients’ pages.
The insights help you optimize your posting schedule based on real data, not guesses, driving authentic and better results.
Follower Lost Rate (Unfollows)
Losing followers happens, but if you’re seeing spikes in your clients’ unfollows, it could be a red flag.
Maybe the tone of your client’s LinkedIn post shifted.
You could also be over-posting, or a particular piece of content may not have landed well with your clients’ LinkedIn audiences.
The metric helps you course-correct before the damage grows and your clients lose followers forever.
Video views and completion rates
When posting video content on your clients’ LinkedIn pages, track how many people actually watch and how long they stick around.
A high completion rate indicates that your videos are engaging from start to finish.
Low rates can mean the content isn’t delivering value early enough to hold your audience’s attention, prompting you to tweak and refine the videos.
Comment volume and sentiment
The number of comments (and their tone) can give you deeper insight into how people feel about your clients’ LinkedIn content.
Are people asking questions, praising, or pushing back?
Comments often reflect genuine engagement and are great for identifying content that sparks conversation.
Top tools for effective LinkedIn analytics
Get the most from LinkedIn analytics with the help of the leading tools below.
Vista Social: All-in-one LinkedIn analytics and social media management
Vista Social offers robust social media analytics (including LinkedIn analytics) features that help you turn raw data into actionable strategies.
The platform provides beautifully visualized dashboards, engagement trends, audience insights, post-level performance, and reporting—all in one place.
Must read: 20+ Social Analytics Tools in 2025: Free And Paid
Vista Social allows you to compare LinkedIn performance with other social media platforms easily, streamlining reporting across your teams or clients.
The platform’s analytics and reporting features include the following:
- Unified analytics across multiple profiles and networks
- Time-saving automation via report scheduling and custom report templates
- Clean, intuitive dashboards that don’t require a data science degree or skill
Must read: Top LinkedIn Automation Tools for Lead Generation
You can track and measure key LinkedIn metrics via Vista Social’s Social Media Performance and Post Performance reports (Personal Profiles).
The LinkedIn metrics Vista Social analyzes include:
- Connections growth
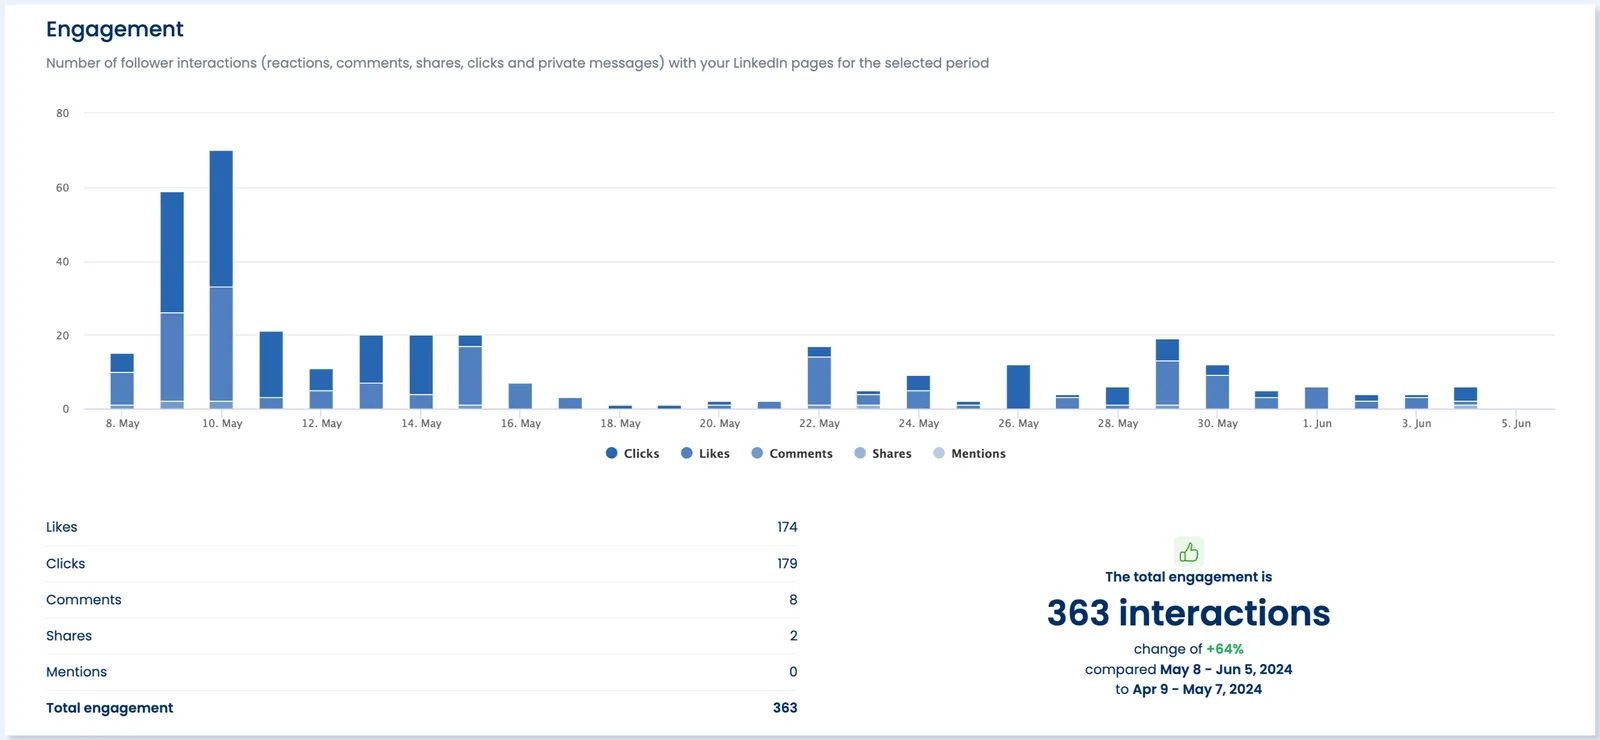
- Number of follower interactions (engagement) with your client’s LinkedIn Personal Page
- Top performing posts
- Engagement rate
For Company page reports, your Social Media Performance and Post Performance reports provide key insights by tracking and analyzing the following metrics.
- Audience growth
- Engagement
- Brand awareness score
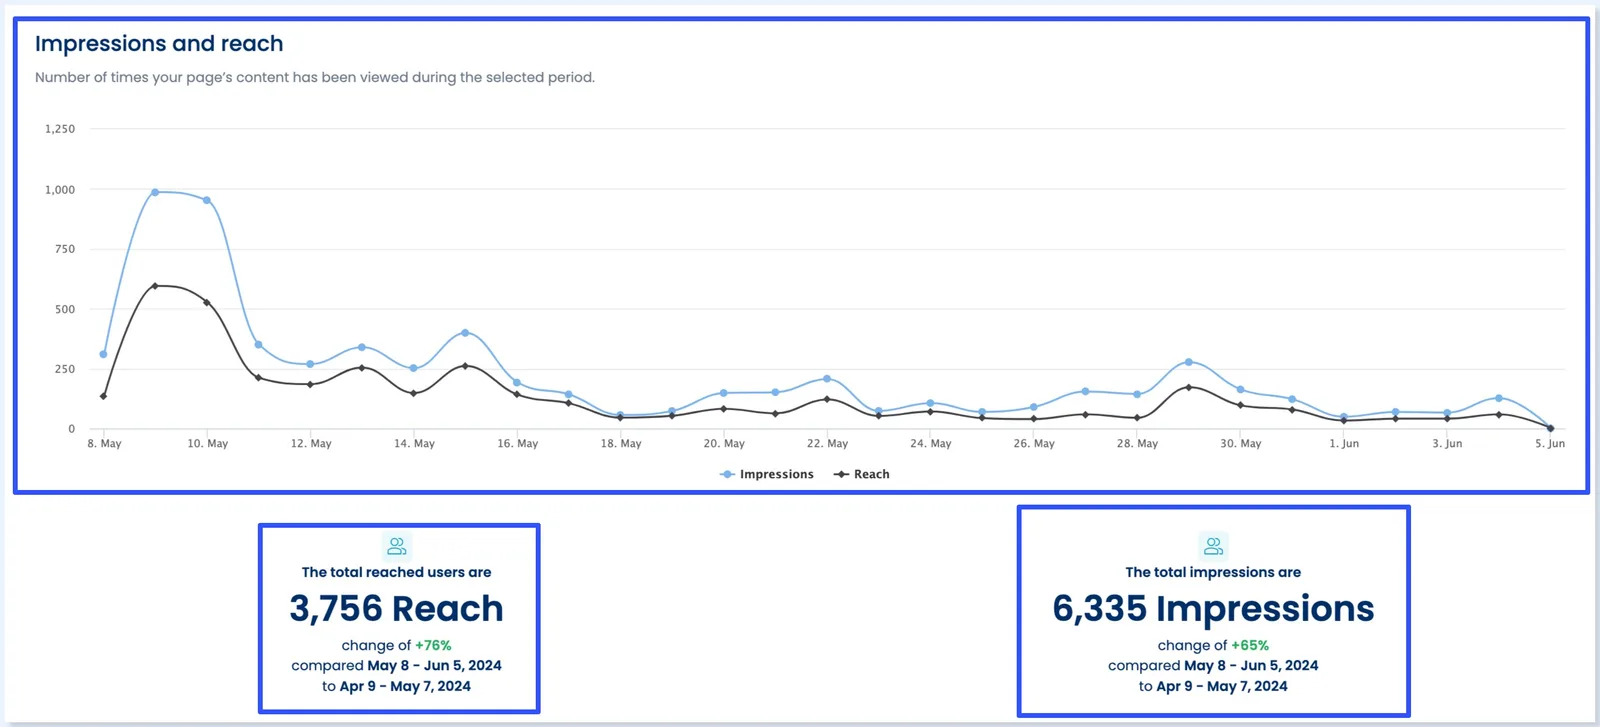
- Impressions and reach
- Hashtags and interactions
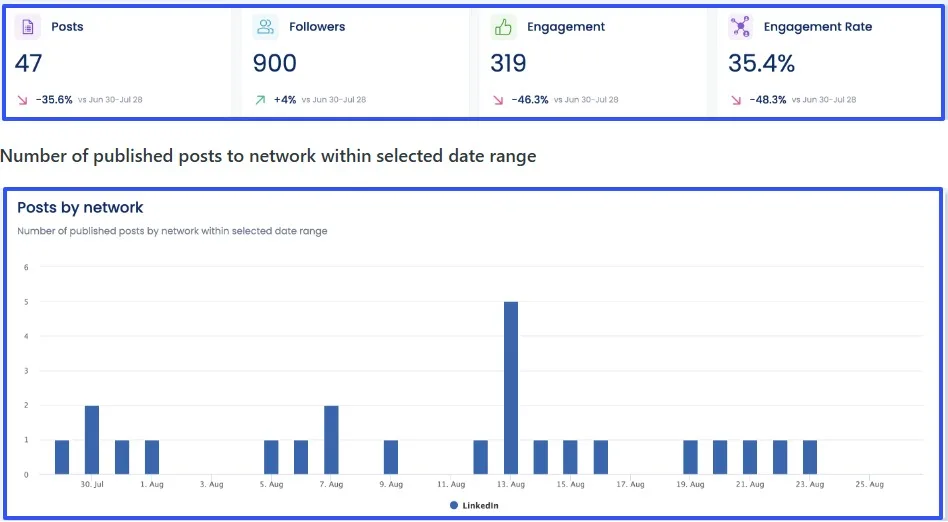
- Total posts and engagement by label
- Top performing posts
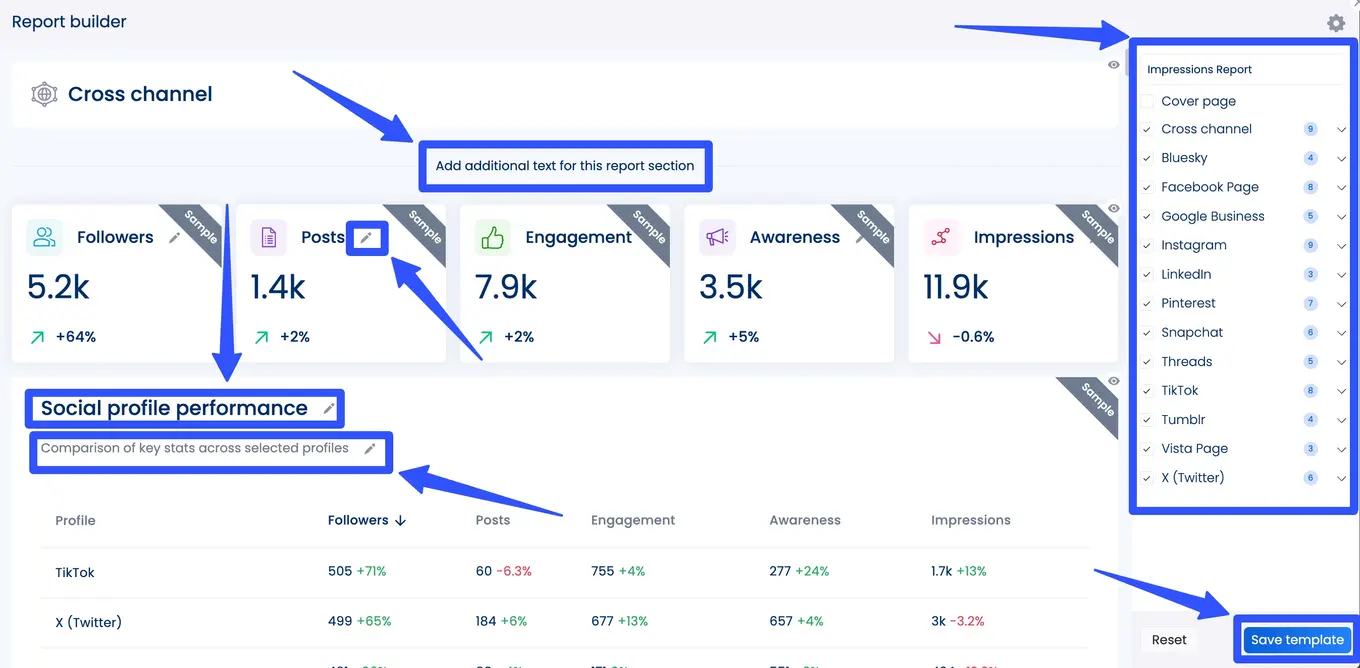
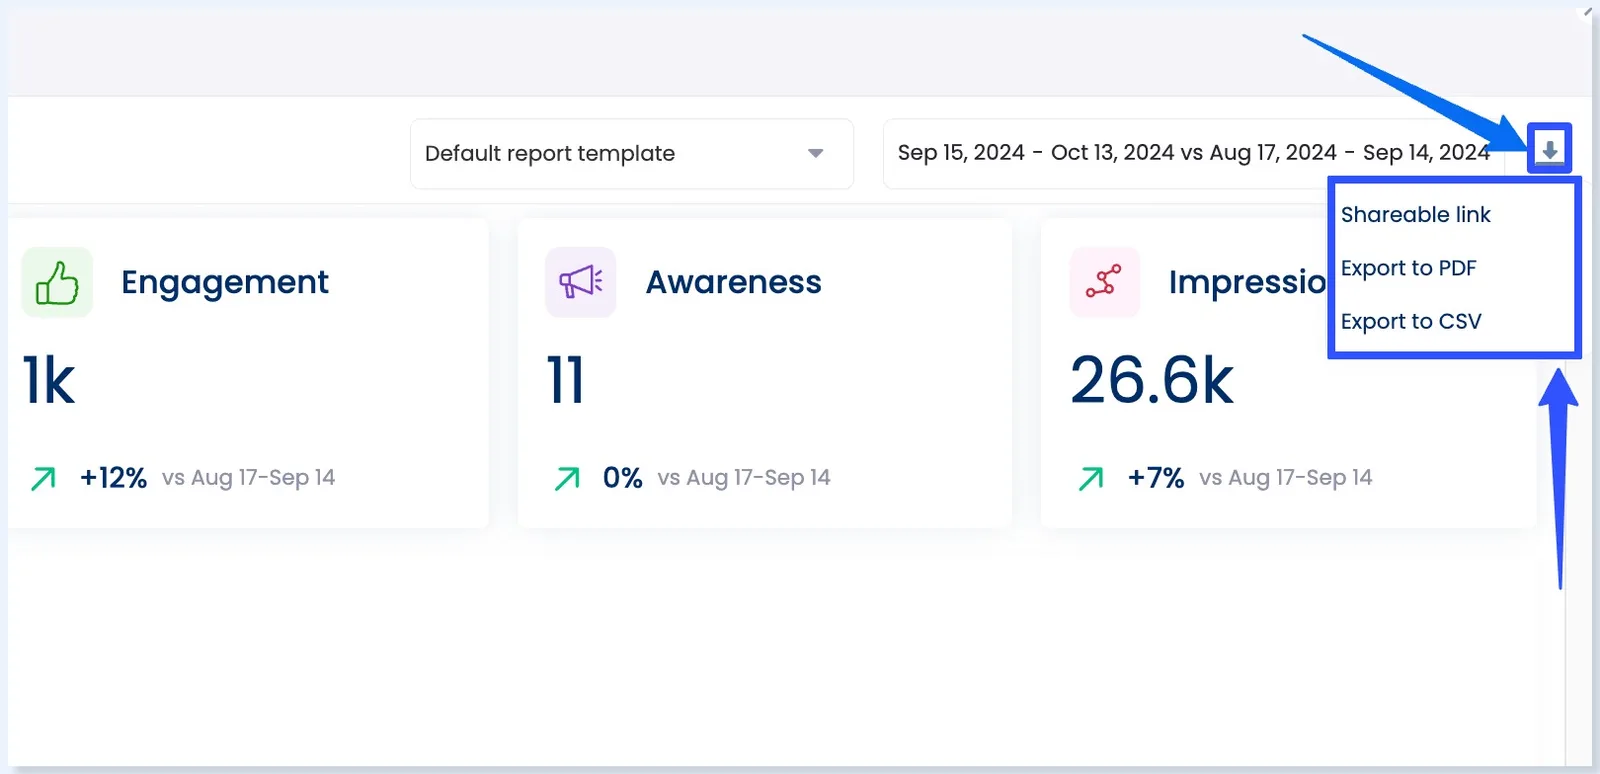
Vista Social also offers report templates (via the Report Builder) that you can easily customize for LinkedIn analytics.
The best part?
You can schedule all your LinkedIn and other social media reports to auto-generate and share with your team and clients.
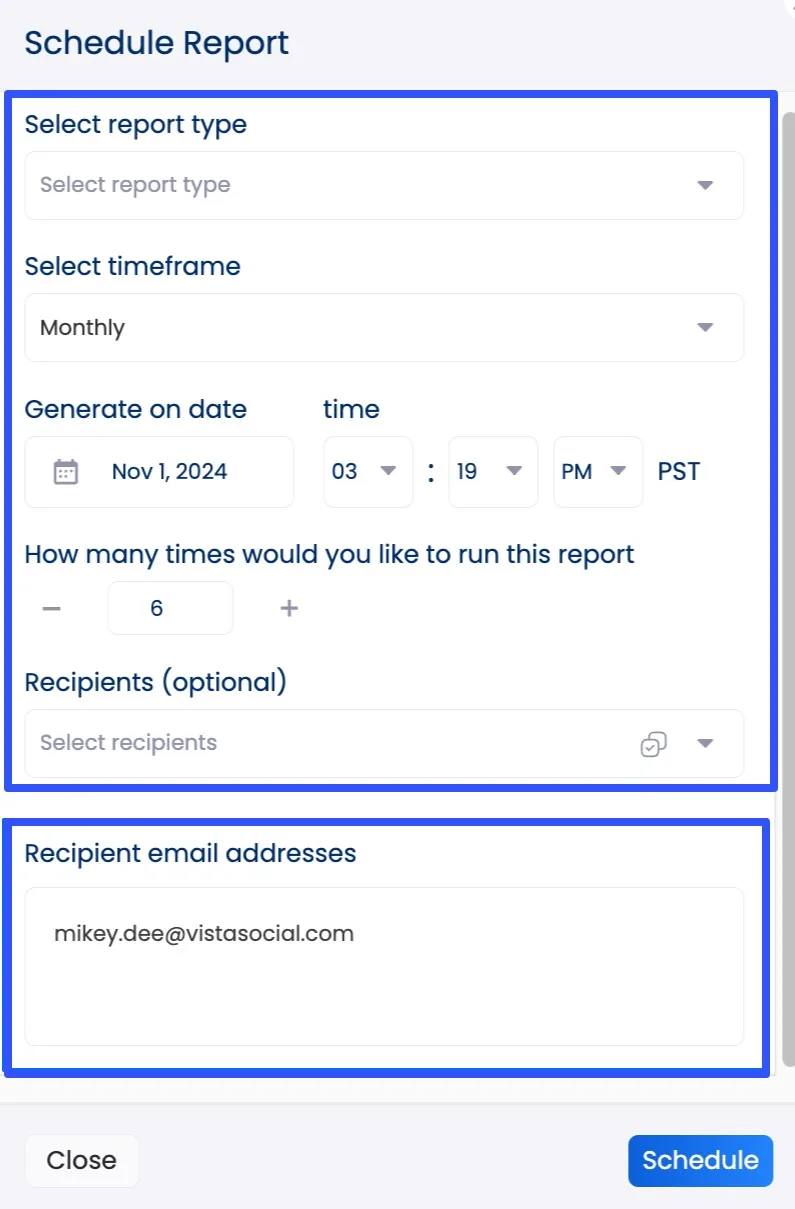
All your reports, including your custom report templates, are shareable via exported PDF or CSV files or direct, interactive links.
With Vista Social’s white label options, you can add your (or your client’s) logo, title, and description for each report.
Vista Social has more features in store, including the following.
- Post scheduling, including content queueing, drafting, and bulk publishing
- Optimal posting time suggestions
- AI Assistant
- Social listening with sentiment analysis
- Engagement management via a smart Social Inbox
- Link in bio tool with customizable landing pages (Vista Page)
- Employee advocacy
- Review management
- Post approval workflows
- Shared content calendar
- DM automation (Coming soon)
Native LinkedIn Analytics tool
If you’re just starting your analytics journey, LinkedIn’s built-in analytics dashboard can be a good option to get a solid overview of how your clients’ content and audience perform.
Must read: 15 LinkedIn Analytics Tools to Boost Your Marketing ROI
You can find key metrics, including post impressions, engagement rate, follower demographics, and company page visits.
While it’s a good starting point, the native tool can feel limited when it comes to custom reporting or deeper analysis.
It’s ideal for quick checks but may not always be the best option for your long-term strategy.
Shield for Personal LinkedIn Profiles
Shield is a LinkedIn analytics tool that helps you track and analyze the performance of your content on the platform.
The tool focuses entirely on LinkedIn personal profile analytics.
It helps you track how your clients’ posts perform over time, including their engagement rates, top-performing content, and growth trends.
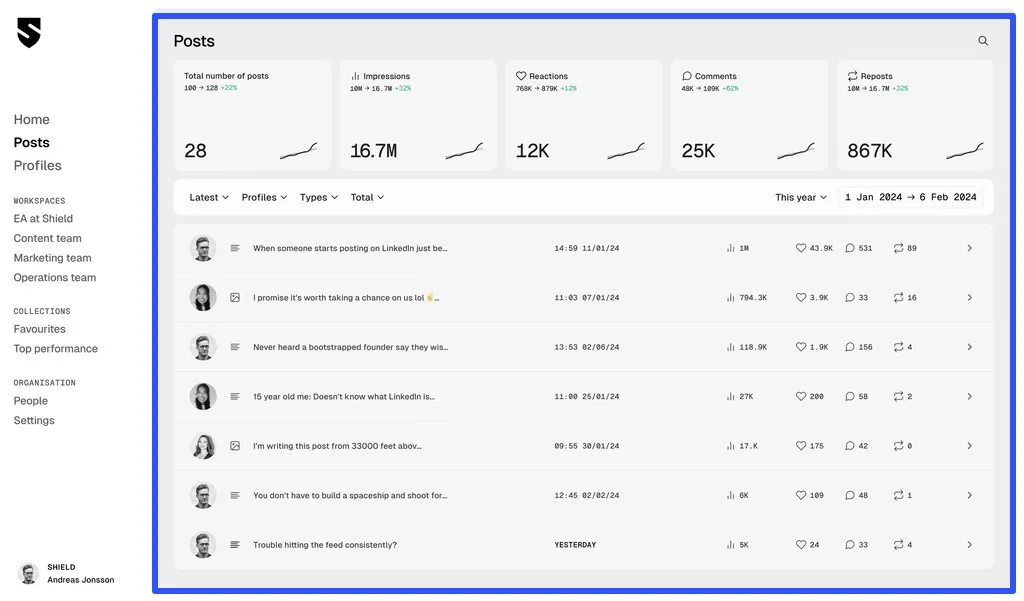
Shield is ideal for marketers, brands, and agencies that want to build a consistent presence on LinkedIn without managing a company page.
Must read: 11 LinkedIn Marketing Experts Worth Following [2025]
LinkedIn Campaign Manager (Ads Analytics)
If you’re running LinkedIn ads for your clients, Campaign Manager can be your go-to analytics tool.
It offers detailed insights into ad performance, click-through rates, conversions, and budget allocation.
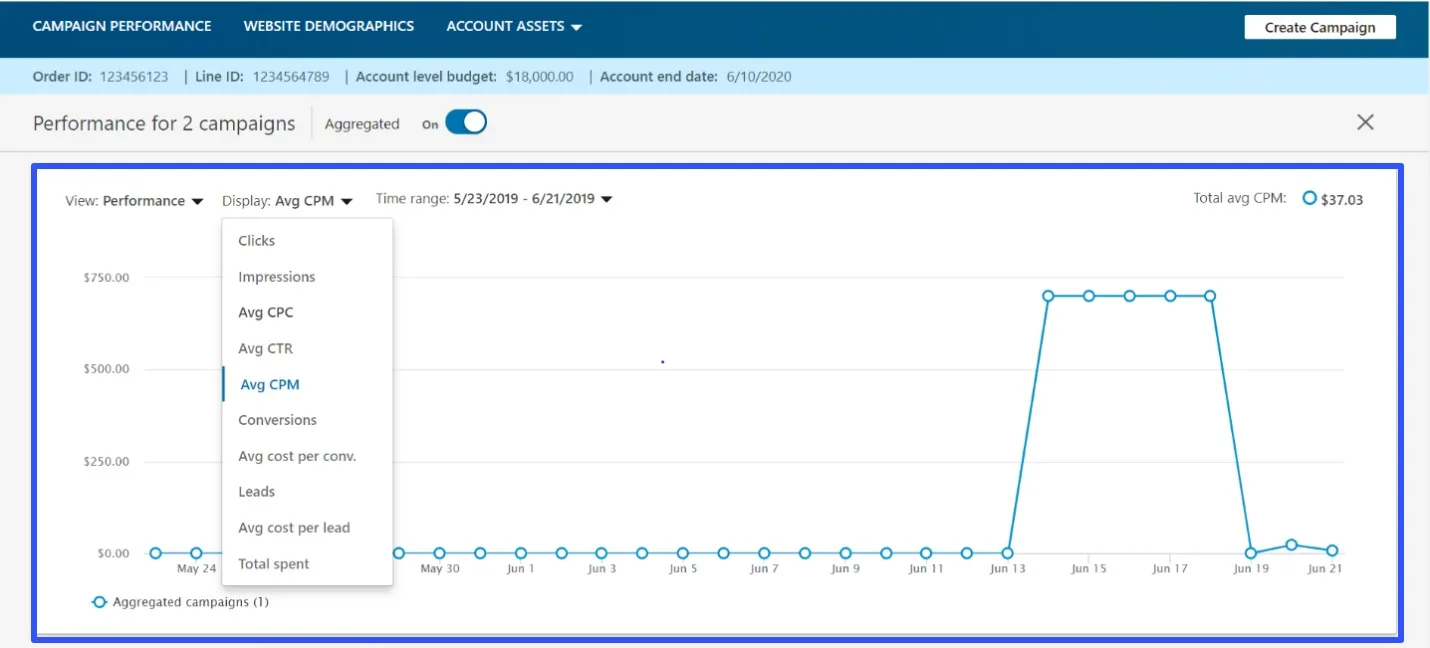
While the tool focuses on analyzing paid content, you can leverage the data insights to help shape and inform your organic LinkedIn content strategy.
Looker Studio for custom reports
If you want highly customized LinkedIn dashboards and reports, Looker Studio can be for you.
Looker Studio lets you create tailored reporting setups using LinkedIn’s API or data exports.
It is especially helpful if you’re aggregating performance from multiple sources or building client-facing reports with specific Key Performance Indicators (KPIs).
However, using the tool requires some setup, as it isn’t plug-and-play.
7 Tips to get the most out of your LinkedIn Analytics data
Turn data into real results with the help of the smart, actionable tips to squeeze every bit of value from your LinkedIn Analytics below.
1. Track the right metrics for your goals
Not all metrics are created equal.
If your client’s goal is brand awareness, focus on impressions, engagement rate, and follower growth.
For lead generation, prioritize click-through rates (CTR), page views, and button clicks.
You can create a simple monthly report with three to five key KPIs that directly tie to your team’s and clients’ objectives.
For example, if you’re promoting a webinar, monitor CTR and sign-ups, not just likes.
2. Monitor trends over time and not just per post
A single viral post may appear effective, but it doesn’t always indicate consistent performance.
Instead, track trends week over week or month over month to understand your clients’ growth trajectory on LinkedIn.
You can use a spreadsheet or, better yet, an analytics dashboard to log metrics regularly.
Highlight spikes or dips and note potential causes, such as a new post format, a banner image, the time of posting, or a boosted post.
Must read: LinkedIn Banner Sizes [2025]: A Complete Guide
For instance, if engagement has dropped over three weeks, review what changed.
Was the content less visual? Was it posted at a different time?
Assessing these can help you identify patterns and trends that inform your LinkedIn content strategy.
3. Break down audience demographics
Understanding who’s engaging with your clients’ content is just as important as how much they’re engaging.
Use LinkedIn’s demographic filters (job title, industry, and location) to check if your clients are attracting their target audiences.
You can compare your clients’ Ideal Customer Profiles (ICPs) with their current follower base to identify areas for improvement.
If there’s a mismatch, consider adjusting your content tone, topic, or hashtags.
Must read: Hashtag Analytics Guide: With Tips, Tools, and Strategies
For example, if your client, who owns a B2B SaaS brand, aims to attract IT decision-makers but finds most of its engagement comes from students, it’s high time to shift gears.
4. Identify top performing content and repurpose it
Look at posts with the highest engagement or click-through rates and break them down.
What was the format? Topic? Call-to-action? Once you know what works, squeeze more value out of it.
You can turn a popular text post into a carousel, turn stats into an infographic, or expand a comment-heavy post into a blog article.
For instance, if your client’s “LinkedIn Tips for Marketers” post gets high traction, convert it into a short video series or a free downloadable checklist.
5. Optimize posting times
Are your clients’ LinkedIn posts getting more reach on Tuesdays at 9 a.m.?
That can be your sweet spot—the best time to post content on LinkedIn to get the most engagement.
You can test various posting times, log the performance, and identify your best-performing windows.
Tools such as Vista Social can recommend optimal times based on the profile’s engagement data and optimization algorithms.
Must read: Top 8 LinkedIn Marketing Tools for 2025
6. Compare organic and paid performance
If you’re running sponsored content for your client’s campaign, compare it to their organic posts to see what’s delivering better ROI.
After all, paid reach can boost visibility, but are those users clicking, engaging, or converting?
The trick is to create side-by-side comparisons in your reports, highlighting key differences in engagement rates, click-through rates, and conversions.
For example, your client’s paid post about a free guide may drive traffic, but their organic post gets more comments.
Use the insights to tweak future ad creatives and drive significant results.
7. Use external tools for deeper analysis
LinkedIn’s built-in analytics are solid but can be limited, especially if you require more in-depth insights.
External tools such as Vista Social offer multi-account tracking, custom reporting, and deeper engagement insights.
The platform lets you monitor trends across LinkedIn and other social platforms in one view.
To get a more comprehensive view, consider setting up dashboards that combine LinkedIn metrics with web traffic (such as from Google Analytics) to connect engagement with real outcomes.
You can use Vista Social to create a weekly report that tracks how LinkedIn traffic contributes to blog views or product sign-ups.
What you can get wrong with LinkedIn Analytics
Steer clear of the following pitfalls to ensure effective LinkedIn analytics.
Overanalyzing individual posts
Focusing too heavily on one post, whether it soared or flopped, can give you a skewed view of your clients’ LinkedIn performance.
A single post doesn’t tell the full story.
What really matters is identifying consistent trends across multiple posts over time.
Look for patterns in format, tone, timing, or topic that repeatedly perform well, and use those insights to inform your strategy.
Not connecting data to business goals
Tracking numbers just for the sake of it can be a huge waste of time.
If you’re not tying your metrics to your clients’ business objectives, such as leads, sign-ups, or brand awareness, it’s challenging to justify your content strategy and marketing efforts.
Must read: LinkedIn Marketing Tips for 2025
Focus on metrics that show movement toward those goals, such as click-through rates for traffic or button clicks for conversions.
Ignoring post timing
Even the best content won’t perform well if no one sees it.
If you’re not paying attention to when your clients’ audiences are most active, you’re missing easy wins.
Review your analytics to identify peak engagement times, then schedule your clients’ posts accordingly to boost visibility and interaction.
Skipping competitor benchmarking
Without comparing your clients’ performance to others in their industries, you’re operating in a vacuum.
You may think your clients’ content is performing well, but how does it compare to similar brands?
Use third-party tools to track competitor activity and set realistic performance benchmarks.
Doing so helps put your clients’ brands in a better position to succeed and gain a competitive edge.
Confusing impressions with engagement
Impressions indicate how many people saw your post but not whether they were interested.
It’s easy to assume that high impressions mean success, but without likes, comments, or clicks, your clients’ content may not be resonating with their LinkedIn audiences.
Prioritize engagement rate and click-throughs to get a clearer picture of actual impact.
Ignoring low performing content
It’s tempting to focus only on the hits, but the misses can be just as important.
Analyzing low-performing posts can reveal gaps in your messaging, timing, or format.
Treat them as learning tools, not failures, and use them to improve your next batch of content.
FAQs on LinkedIn Analytics
Who can access LinkedIn Analytics?
Any user with a Personal LinkedIn profile can view basic metrics, including profile views, post impressions, follower counts, and search appearances.
Also, a Company Page admin or user with Analyst access can view deeper insights, including content performance, visitor demographics, follower analytics, leads, competitor benchmarks, and more.
Can you export your LinkedIn Analytics data?
Yes.
Personal and page-level dashboards allow data exporting, typically in CSV or XLS formats, which is great for deeper analysis or reporting purposes.
LinkedIn lets you export reports on content, followers, competitors, leads, employee advocacy, and visitor analytics.
Do LinkedIn Analytics tools exist outside the platform’s native dashboard?
Yes.
Many third-party analytics tools seamlessly integrate with LinkedIn.
Must read: 15 LinkedIn Analytics Tools to Boost Your Marketing ROI
For instance, the social media management platform Vista Social offers enhanced features, including content calendars, competitor insights, and LinkedIn data reporting.
Are there limitations to native LinkedIn Analytics?
Yes, native LinkedIn Analytics may lack the following:
- Deep demographic targeting beyond core categories
- Advanced attribution, such as multi-touch conversion tracking
- Granular competitor benchmarking, unless you use premium third-party analytics tools
Turn LinkedIn analytics insights into impact
LinkedIn Analytics can be your secret weapon for smarter strategy, better content, and real business results.
Whether you want to help grow your clients’ audiences, generate leads, or boost brand awareness, effective analytics gives you the clarity to make every post count.
From engagement rates to follower growth and everything in between, the right insights can transform “just posting” into a data-driven strategy that gets you your expected results.
And if you’re ready to take your LinkedIn reporting to the next level with smarter dashboards, automated reports, and multi-platform tracking, Vista Social has your back. Start your Vista Social account now.
Try Vista Social for free
A social media management platform that actually helps you grow with easy-to-use content planning, scheduling, engagement and analytics tools.
Get Started NowAbout the Author

Content Writer
Jimmy Rodela is a social media and content marketing consultant with over 9 years of experience, with work appearing on sites such as Business.com, Yahoo, SEMRush, and SearchEnginePeople. He specializes in social media, content marketing, SaaS, small business strategy, marketing automation, and content development.
Loading related tools...


Tools
PublishingAnalyticsEngagementIntegrations
FacebookInstagramLinkedInRedditSnapchatThreadsTikTokX (Twitter)YouTubeBlueskyVista Page (link-in-bio)All IntegrationsCopyright © 2026 Vista Social LLC. All Rights Reserved.