

Published on October 15, 2026
9 min to read
Why Social Media Data Silos Limit Leadership Visibility

Summarize with AI

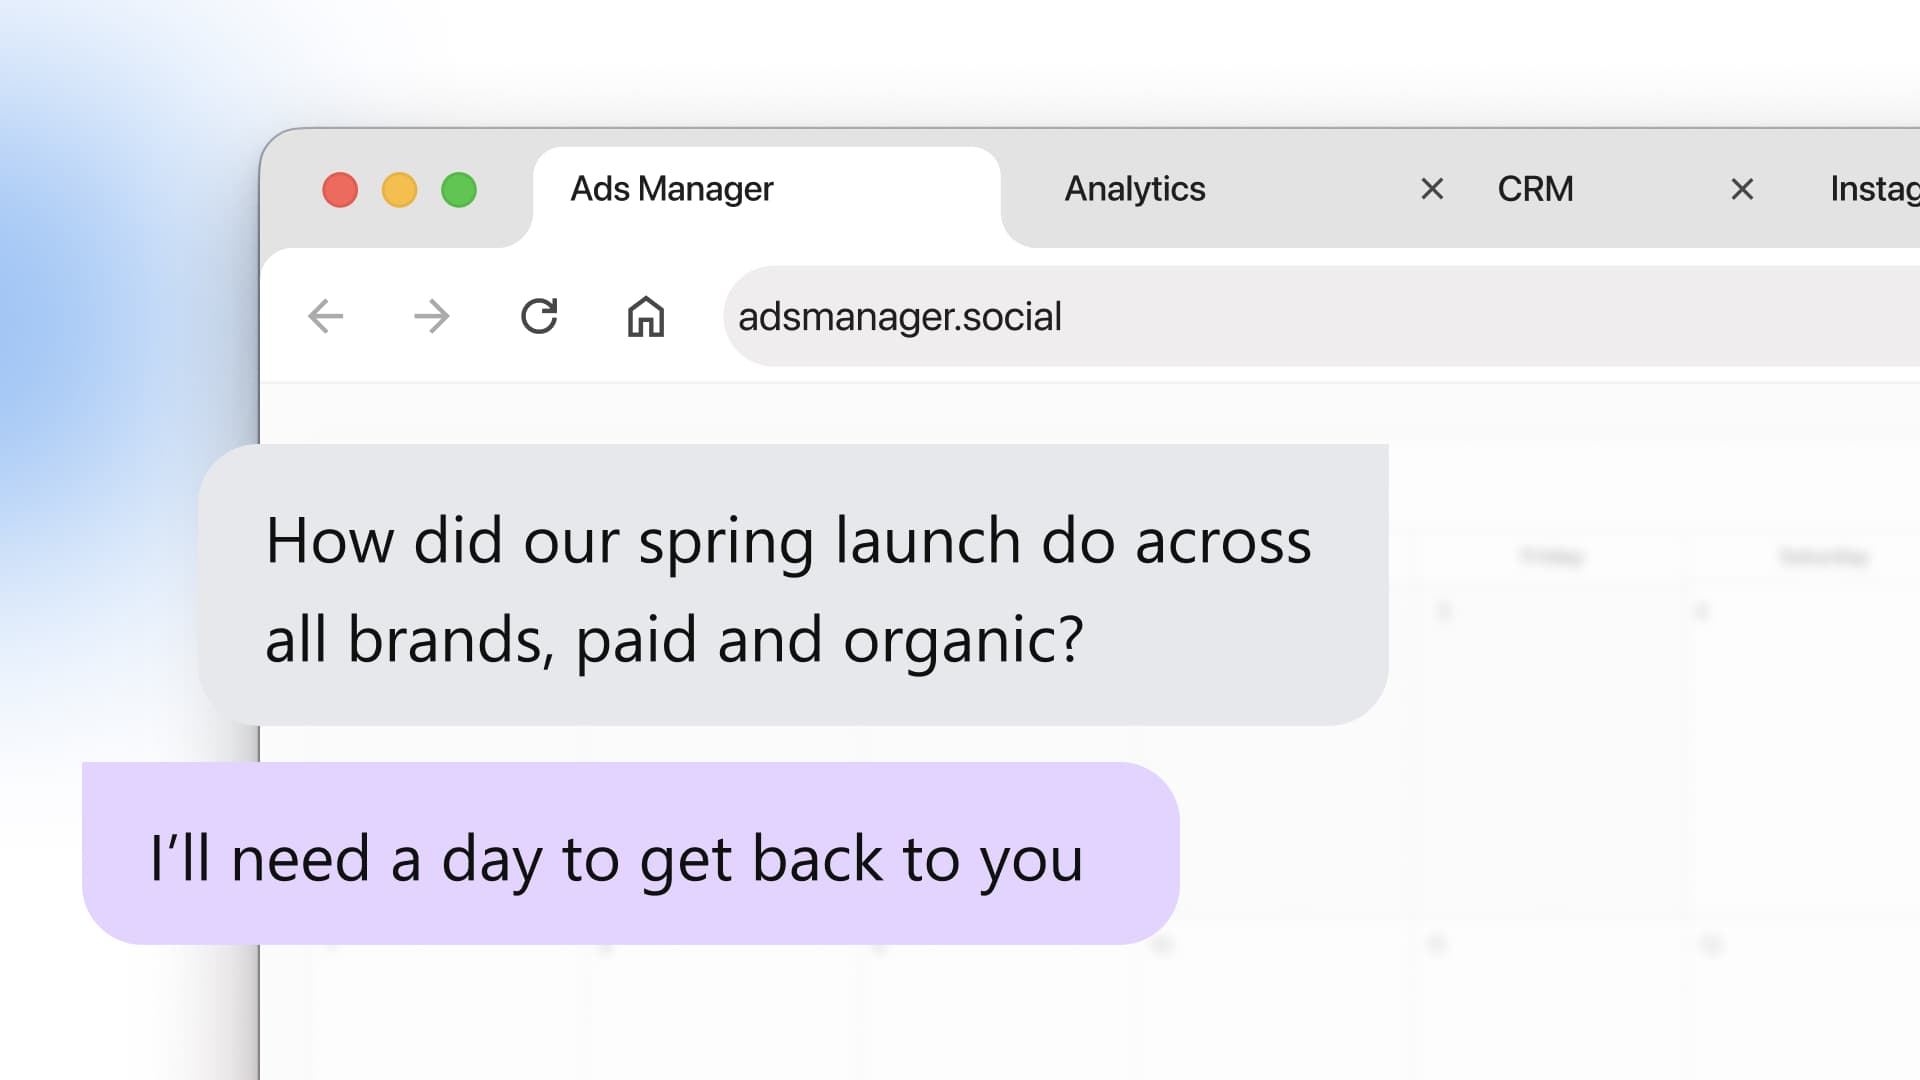
Table of contents
Summarize with AI

ChatGPT

Claude

Perplexity
Share

Vista Social

X (Twitter)


If the analyst behind your social report took leave, could anyone else explain how the numbers were put together?
The deck might still look complete, with organic results, paid performance, and website traffic in neatly labeled columns. What’s harder to hand over is the working knowledge behind them: which ad accounts were included, how campaigns were matched, and why one region’s engagement needed adjusting.
Social media data silos turn portfolio reporting into work your team has to rebuild as the business grows. Connect the evidence and definitions, then use AI to keep the recurring comparison ready for review.
The short version
- Make the roll-up repeatable: Leadership needs one view across brands and regions, with the same scope and definitions each time.
- Expose what the total leaves out: Missing accounts, overlapping audiences, and mismatched periods change what a result means.
- Connect your approved AI tools: MCP gives an approved assistant access to available reporting tools; Ask Vista, Skills, and agents handle retrieval and recurring preparation.
- Keep the business judgment: Your team reviews the evidence, preserves source limits, and decides what the results justify.
Table of contents
Why each new brand makes the program harder to see
Adding a brand expands your responsibility immediately. Its social profiles, agency relationships, ad accounts, and reporting conventions don’t arrive as a ready-made extension of your portfolio view.
An acquired brand might use a shared regional ad account while keeping separate local profiles. Its website belongs to a different analytics property, and its campaign names don’t match the rest of the business. You need to understand those relationships before including their results in the global roll-up.
Without that mapping, your roll-up either leaves the brand out or includes figures whose coverage still needs explaining. You lose a dependable comparison even when the local team has done the reporting work well.
The workaround often becomes another regional workbook. Its local adjustments solve the immediate request, then have to be matched to the global version when the next question arrives. A new market now adds another reconciliation path as well as another set of accounts.
This is why a larger enterprise social media program needs a view that another authorized person can reproduce. A regional report can be excellent and still leave you unable to inspect the portfolio. Each new brand increases the distance between those two views unless its data connections become part of the setup.
Why the numbers don’t match
Connecting the sources exposes a second layer of data fragmentation: the fields don’t always measure the same thing. Matching column headings is not enough to make a fair comparison.
- Metric definitions: A video view, an impression, and an engagement rate each need their own counting rules. Keep the source definition with the result.
- Reporting periods: A calendar-month export and a rolling window answer different questions, even when both carry the same campaign name.
- Audience overlap: Someone reached by an organic post can also see its promotion. Adding the two reach figures doesn’t establish the number of distinct people reached.
- Missing coverage: An unavailable ad account is a gap, not zero paid activity. A total that hides the gap makes the region look weaker than the available evidence supports.
A current example appears in Instagram’s report definitions: views are included under impressions in Vista Social’s cross-channel reports. You need that mapping to understand why the native screen and combined report use different labels. The common heading doesn’t make every network’s counting rules identical.
The same issue affects rates. If one region divides engagements by followers and another uses impressions, averaging the percentages won’t produce a meaningful portfolio benchmark. Decide which measure answers the question, and preserve the distinction when the sources don’t support the same calculation.
How fragmentation delays leadership decisions
Leadership thinks about the campaign as one investment. Your reporting divides the answer by system owner, metric definition, and the date each export was pulled. Budget discussions shift from deciding what to do next to agreeing on what happened.
The 2025 CMO Survey found that 51.8% of respondents identified focusing data and analytics on the most important marketing problems as a challenge. The report identifies it as the fastest-growing challenge in its comparison. More data isn’t resolving the gap between evidence and a decision.
These are different questions, and each reveals a different missing connection:
| Leadership asks | Evidence needed | Decision held up |
|---|---|---|
| Should more markets use this campaign? | Comparable organic and paid results tied to the same campaign and period | Whether to expand the campaign |
| Which region needs attention? | A regional breakdown that distinguishes weak results from missing accounts | Whether to change the work or repair coverage |
| Did the activity support pipeline? | Website and CRM evidence with an agreed attribution method | What commercial contribution you can defend |
An overall total also needs a breakdown. Growth in a large brand can outweigh a smaller market’s decline, leaving the portfolio positive while a regional problem goes unnoticed. Leadership needs both the roll-up and a way to inspect what is underneath it.
The roll-up needs to exist before someone asks for the deck.
If the evidence is already connected but the report list keeps expanding, why social media reporting never gets faster covers that separate problem. A new template won’t repair a missing data connection, and a new connection won’t decide which reports are still worth sending.
What a single source of truth should contain
A single source of truth is the agreed reporting view, with named sources, definitions, and owners, that everyone uses to evaluate the program. It doesn’t require every original record to live in the same database. It requires the combined answer to survive beyond the person who assembled it.
For cross-channel reporting, the minimum is:
- One portfolio scope: The included brands, regions, profiles, ad accounts, and web properties are explicit. Shared accounts have a maintained mapping.
- One comparison method: Campaign identifiers, dates, timezones, and metric definitions travel with the results, including limits on what can be combined.
- Visible gaps and changes: Missing values remain distinguishable from zero, and corrections have an owner and an explanation.
- Repeatable access: Another authorized colleague can reopen the view, apply the same scope, and reach the same underlying figures.
Your social reporting workspace can serve the questions covered by its connected sources. If your warehouse already combines social, web, and CRM evidence reliably, keep that as the destination. Unified analytics is useful when it resolves the joins, rather than adding a new screen leadership has to reconcile.
Salesforce’s 2026 research found high performers were 2.4 times more likely than underperformers to have unified their data sources. The groups reflect satisfaction with marketing results. That supports the case for connected evidence without proving that a new dashboard causes stronger performance.
The maintained view and the quarterly deck have different jobs. The view supports a follow-up; the deck records your interpretation and recommendation at a point in time. Once the evidence is connected, AI has a useful job too: retrieve the same results, answer the follow-up, and prepare the recurring review.
To see how that works across your brand setup, book a Vista Social walkthrough and bring a question your last roll-up couldn’t answer.
How Vista Social brings the program into one view
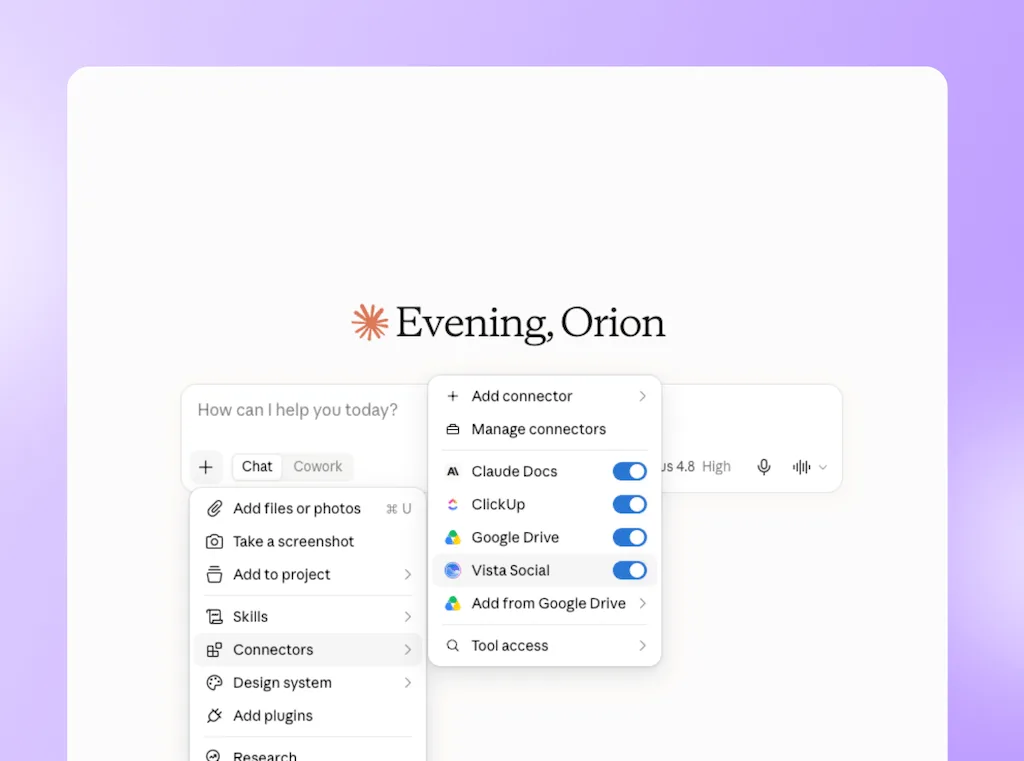
Start with the accounts and evidence the question needs. Vista Social connects supported social, paid, and website results, while MCP gives your approved AI environment a way to work with the available reporting tools.
Connect your AI environment with MCP
Through MCP, an approved AI assistant can retrieve daily profile metrics and published-post performance from Vista Social. Use it to compare connected brands and time periods from the AI environment your organization approves. Define the permitted account scope and inspect the returned evidence before acting on the explanation.
Bring the campaign results together
Different report views answer different parts of the question:
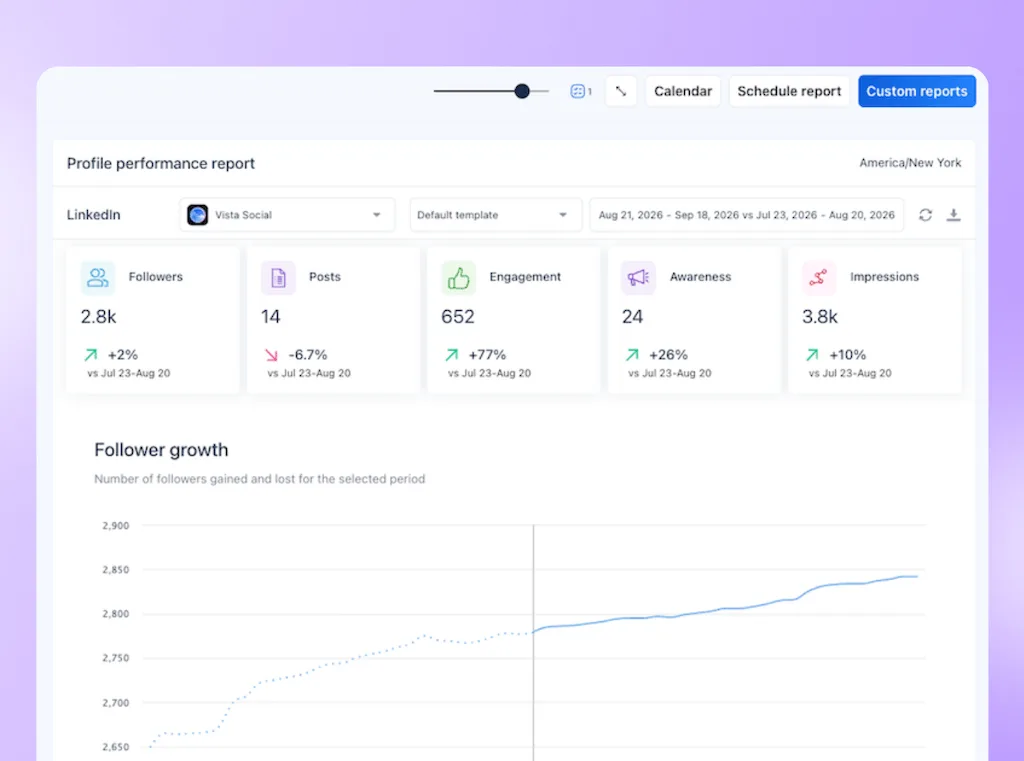
- Profiles and campaigns: Profile Performance compares selected profiles across networks. A tag-filtered Post Performance report isolates the posts carrying the campaign tag.
- Paid activity: Link the relevant ad account for supported paid reporting. The linked account and available metrics determine the coverage, so include that scope with the comparison.
- Website evidence: Connect Google Analytics to include supported website metrics in reports. Website visits remain separate from a claim about CRM pipeline.
Put Ask Vista to work on the report
Ask Vista retrieves profile and post results and creates downloadable reports and presentations. Give it the agreed profiles, dates and campaign scope, and require it to identify unavailable metrics rather than fill the gaps.
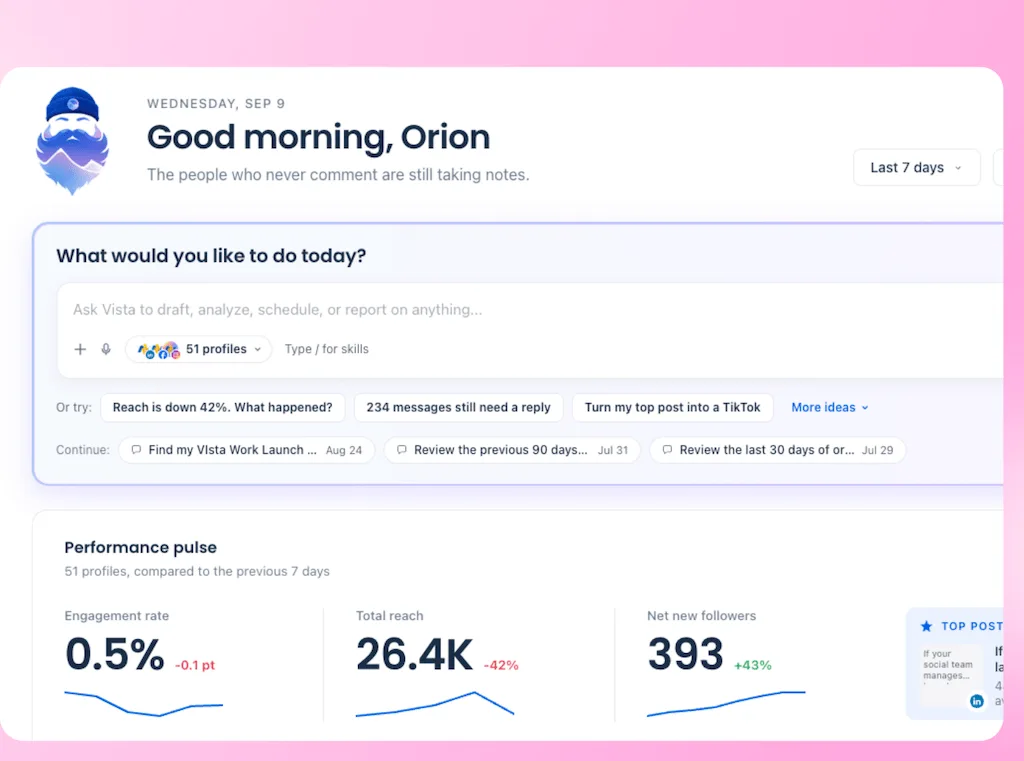
Review the comparison and explanation before creating the version for leadership; the AI reporting guide covers that workflow in more detail.
Repeat the work with Skills and agents
Save the reviewed method as a shared Skill for reuse, or schedule an agent to run the report weekly or monthly. Deliver its draft internally in Ask Vista, by email or through Slack; instruct the agent to create follow-up tasks through an enabled ClickUp connector where needed.
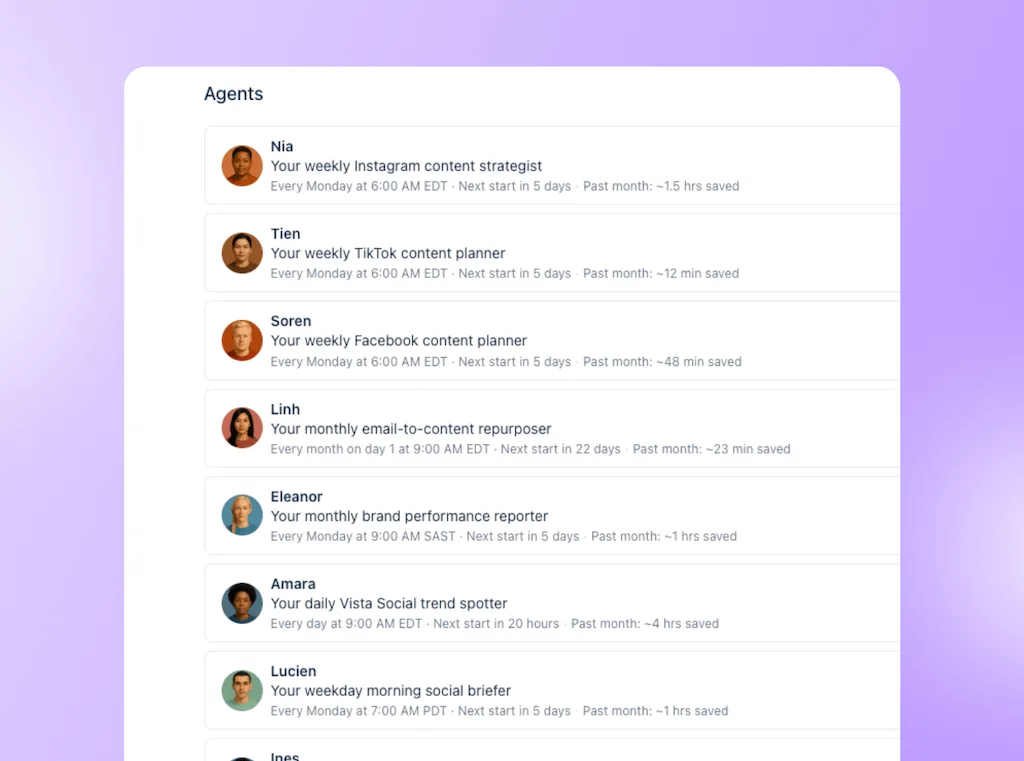
Review the configured run and its AI-credit use before relying on the schedule. Agents require Advanced, Scale or Enterprise; Slack/Teams require the Premium integrations add-on. Keep leadership distribution behind your internal review.
Share the reviewed evidence
A standard report’s interactive link opens without a platform login and keeps the date range selected at creation. Links remain active unless deleted, so control who receives them. Ask Vista’s generated documents have their own download and sharing controls; inspect the document before distributing it.
Keep your BI setup
Vista Social’s API supplies social analytics to your systems and is included with Enterprise or available through the API add-on. The Looker Studio integration is an add-on. Your BI team still owns CRM joins and the method used to measure social media ROI; a social feed doesn’t establish attribution by itself.
Keep the roll-up reliable as the program grows
A connected view needs maintenance when the portfolio changes. Make those changes visible before they alter the answer in a leadership meeting:
- New brands and accounts: Add their ownership, campaign mapping and report selection during setup, rather than waiting for the first quarterly request.
- Changed definitions: Record the effective date and affected measures so a counting change isn’t presented as a shift in audience behavior.
- Missing or delayed data: Keep the gap visible, name the owner and state when the source will be checked again.
- Changed access: Review source permissions and report recipients when people move roles. A useful portfolio view doesn’t require every operator to see every sensitive business record.
Vista Social’s standard backfill is up to 60 days where supported, and paid history is limited to 30 days. Reports refresh every five to six hours rather than continuously, and network/API differences still affect availability. Keep older exports and their definitions for longer comparisons when switching tools.
Give leadership one view of the program
Your portfolio should remain understandable when another brand joins or your analyst is away. Keep the evidence and definitions accessible, let Ask Vista and agents prepare the recurring comparisons, and use the review to decide where to invest.
Book a Vista Social walkthrough and bring a cross-brand question from your last review. Use it to test the data coverage, AI workflow and remaining handoffs before expanding the setup across your portfolio.
Frequently asked questions
What is social media data?
It covers network performance, paid campaign results and the connected website or CRM evidence used to assess social’s contribution. For a multi-brand program, that evidence also needs brand, region and location context.
Does every specialist tool create a data silo?
No. A specialist tool can feed a shared reporting process and remain the right home for its records. It becomes a silo when each cross-system question requires someone to rebuild the handoff.
Why don’t native analytics and my reporting tool match?
Check definitions, dates, timezone, refresh timing and the measures available through the network’s API. Investigate unexplained gaps, but don’t change valid figures just to make two screens agree.
Do we need a data warehouse?
Use one when the required joins and business rules extend beyond the social workspace. If your current warehouse already provides a reliable cross-brand view, improve its social feed rather than building a competing dashboard.
Can AI fix social media data silos?
Ask Vista and MCP-connected assistants retrieve accessible results, while Skills and agents make the reporting work reusable and recurring. Those actions reduce manual handoffs, but they don’t replace source access, agreed definitions or your approval of a business conclusion.
Try Vista Social for free
A social media management platform that actually helps you grow with easy-to-use content planning, scheduling, engagement and analytics tools.
Get Started NowAbout the Author

Content Writer
Orion loves to write content that refuses to be boring. As part of Vista Social, he helps brands, creators, and agencies stop doom scrolling and start winning with social media. When he's not in front of a keyboard, he's watching films in IMAX with his wife, dissecting football tactics (the European kind), and getting lost in a good book.
Loading related tools...

The most complete social media management platform for teams who demand more.






Tools
PublishingAnalyticsEngagementIntegrations
FacebookInstagramLinkedInRedditSnapchatThreadsTikTokX (Twitter)YouTubeMCPVista Page (link-in-bio)All IntegrationsCopyright © 2026 Vista Social LLC. All Rights Reserved.