


New
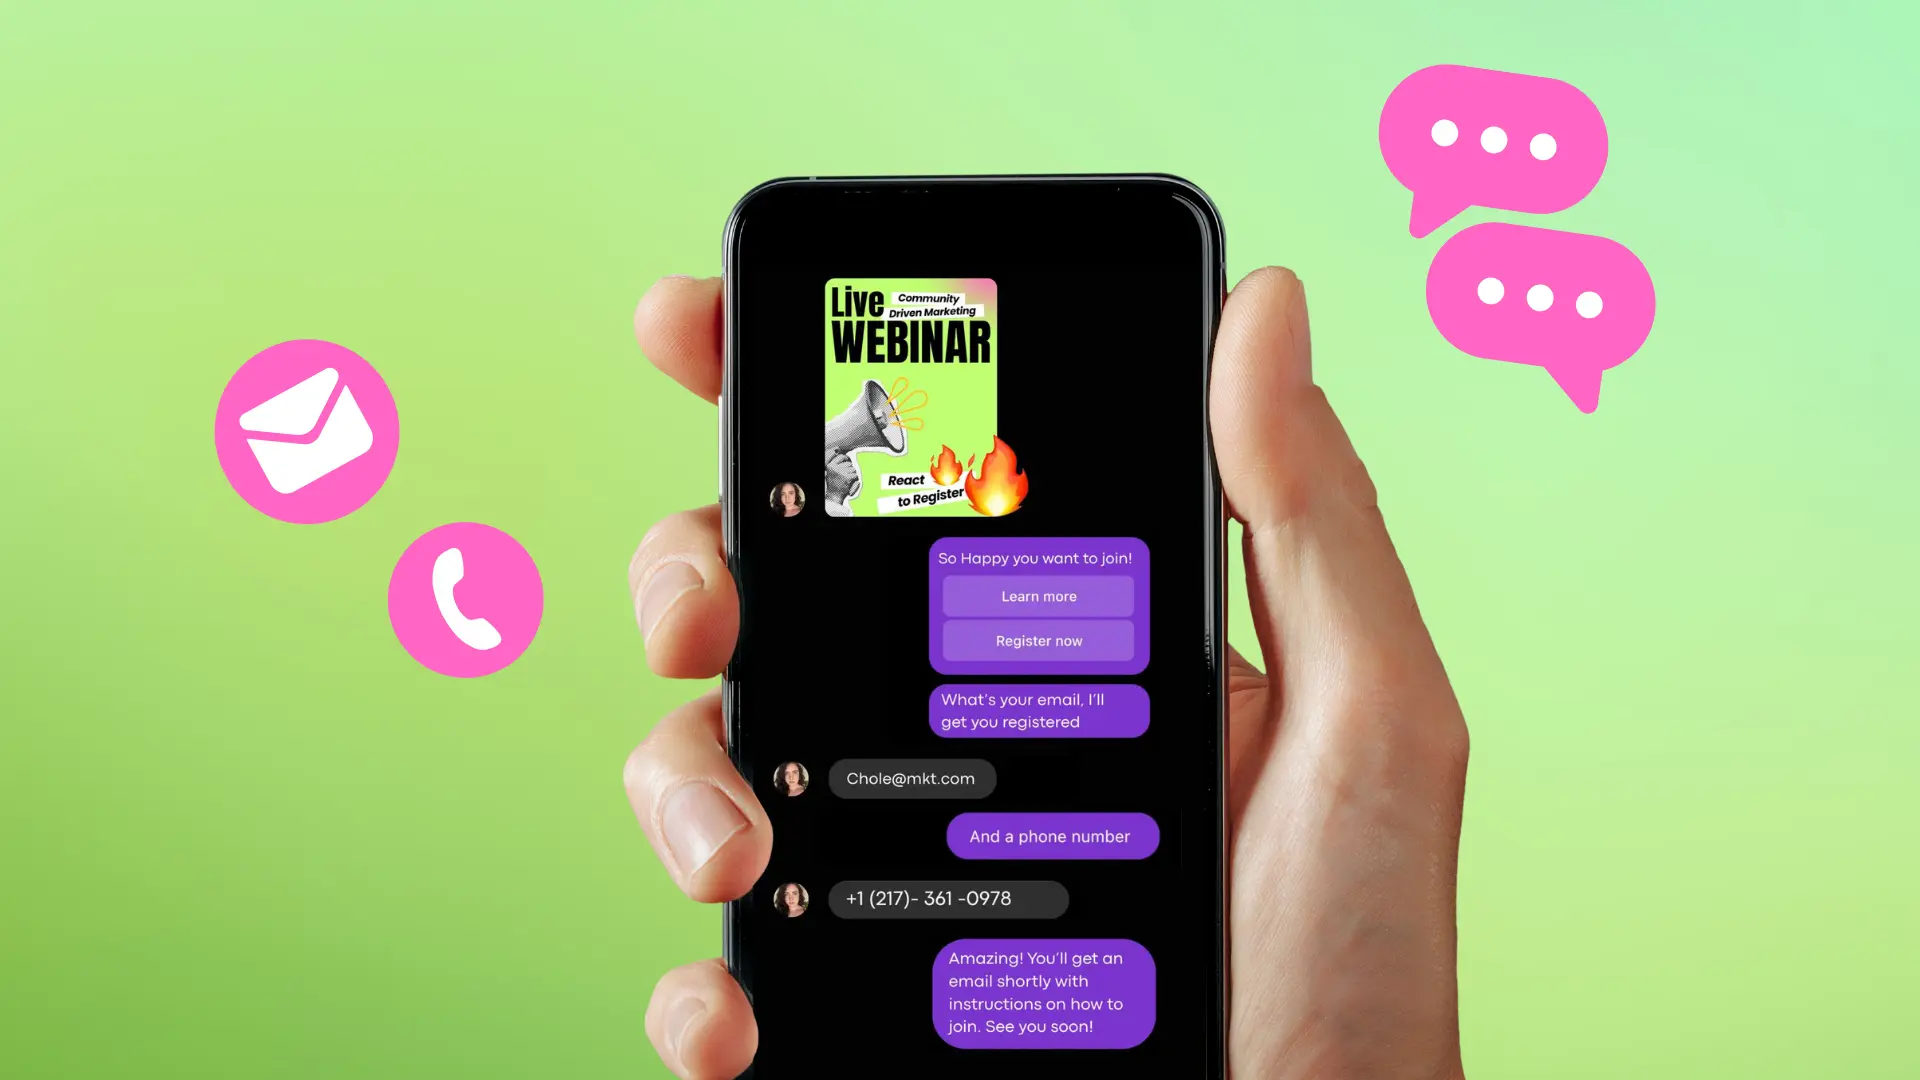
Turn Your DMs Into Lead Gen!
Learn how to collect lead data from your DMs such as email addresses, phone numbers, and more right from your social inbox. If you are not yet automating your DMs your competitors are outpacing you.


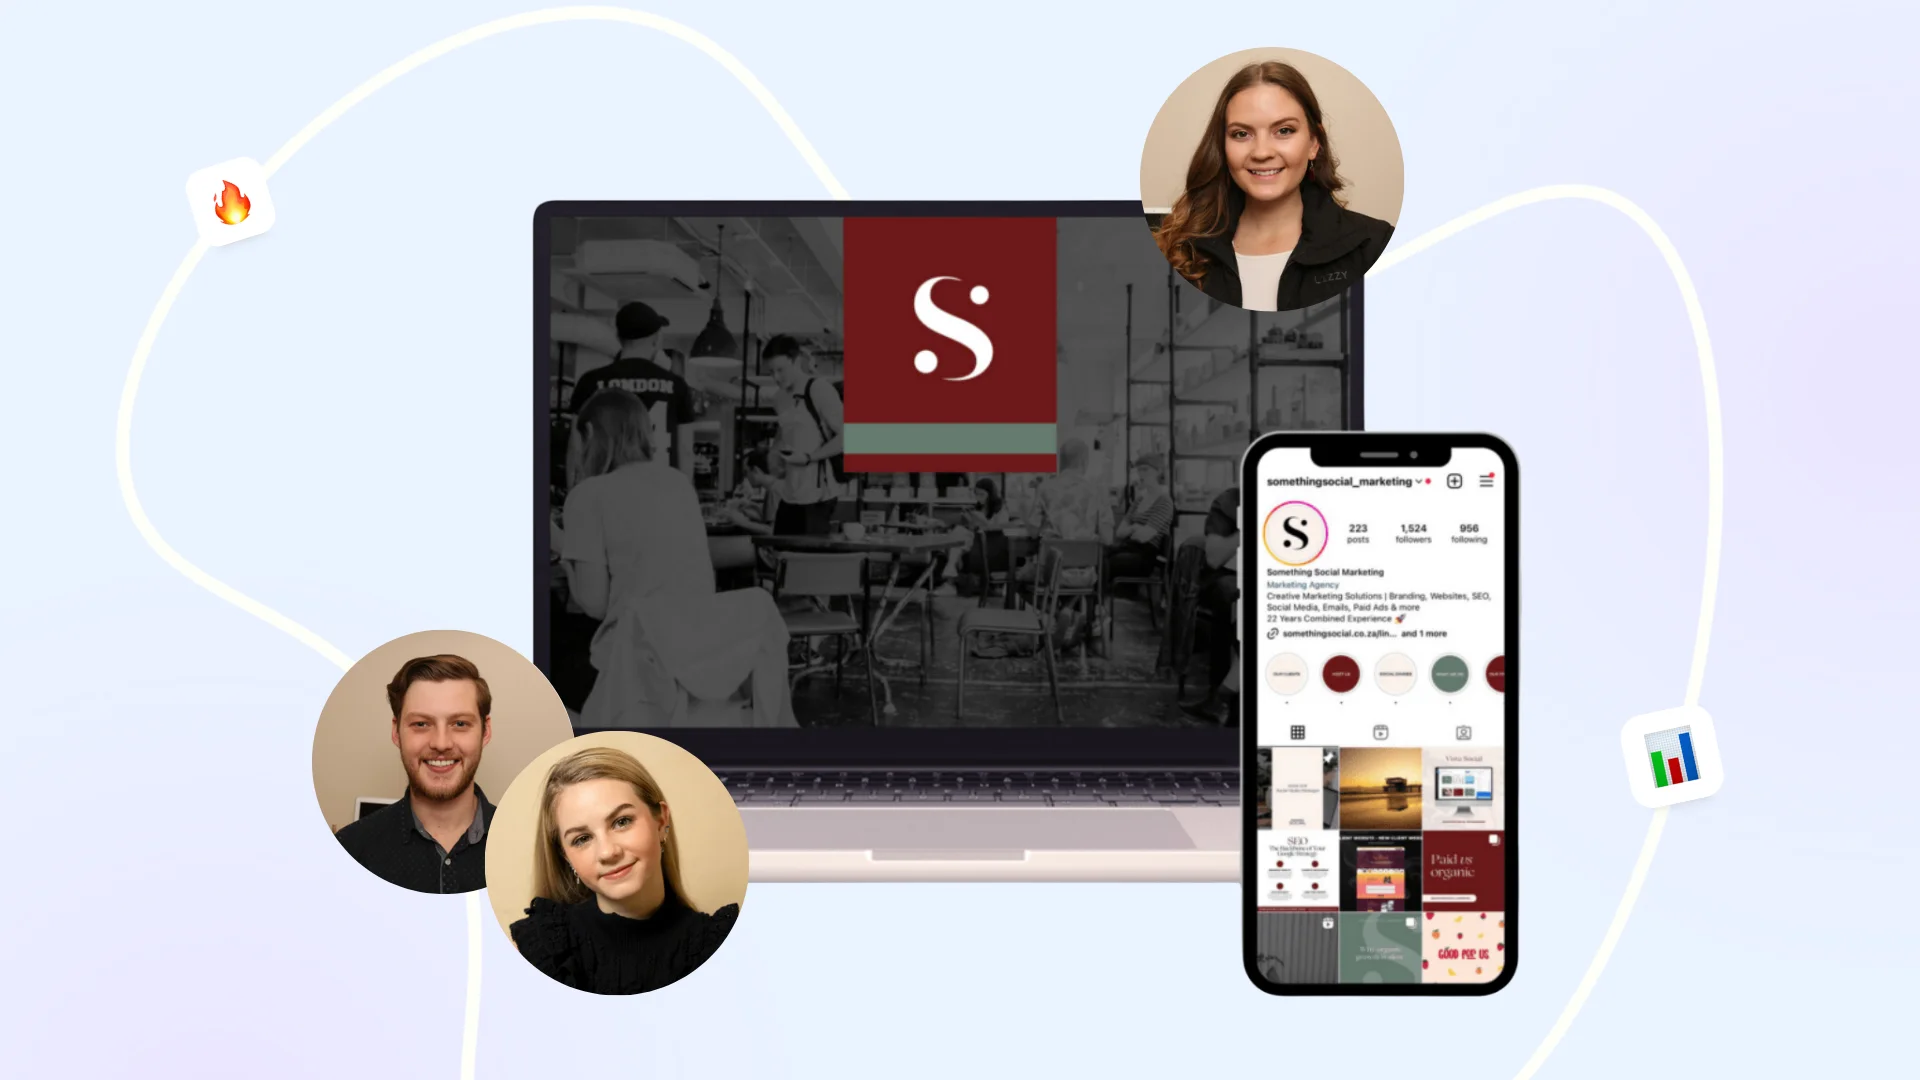
How Something Social Saved 75% of Their Time and Increased Revenue by 15%
See how a fast-growing agency improved operations, cut down hours of manual work, and unlocked new revenue opportunities with Vista Social.


New

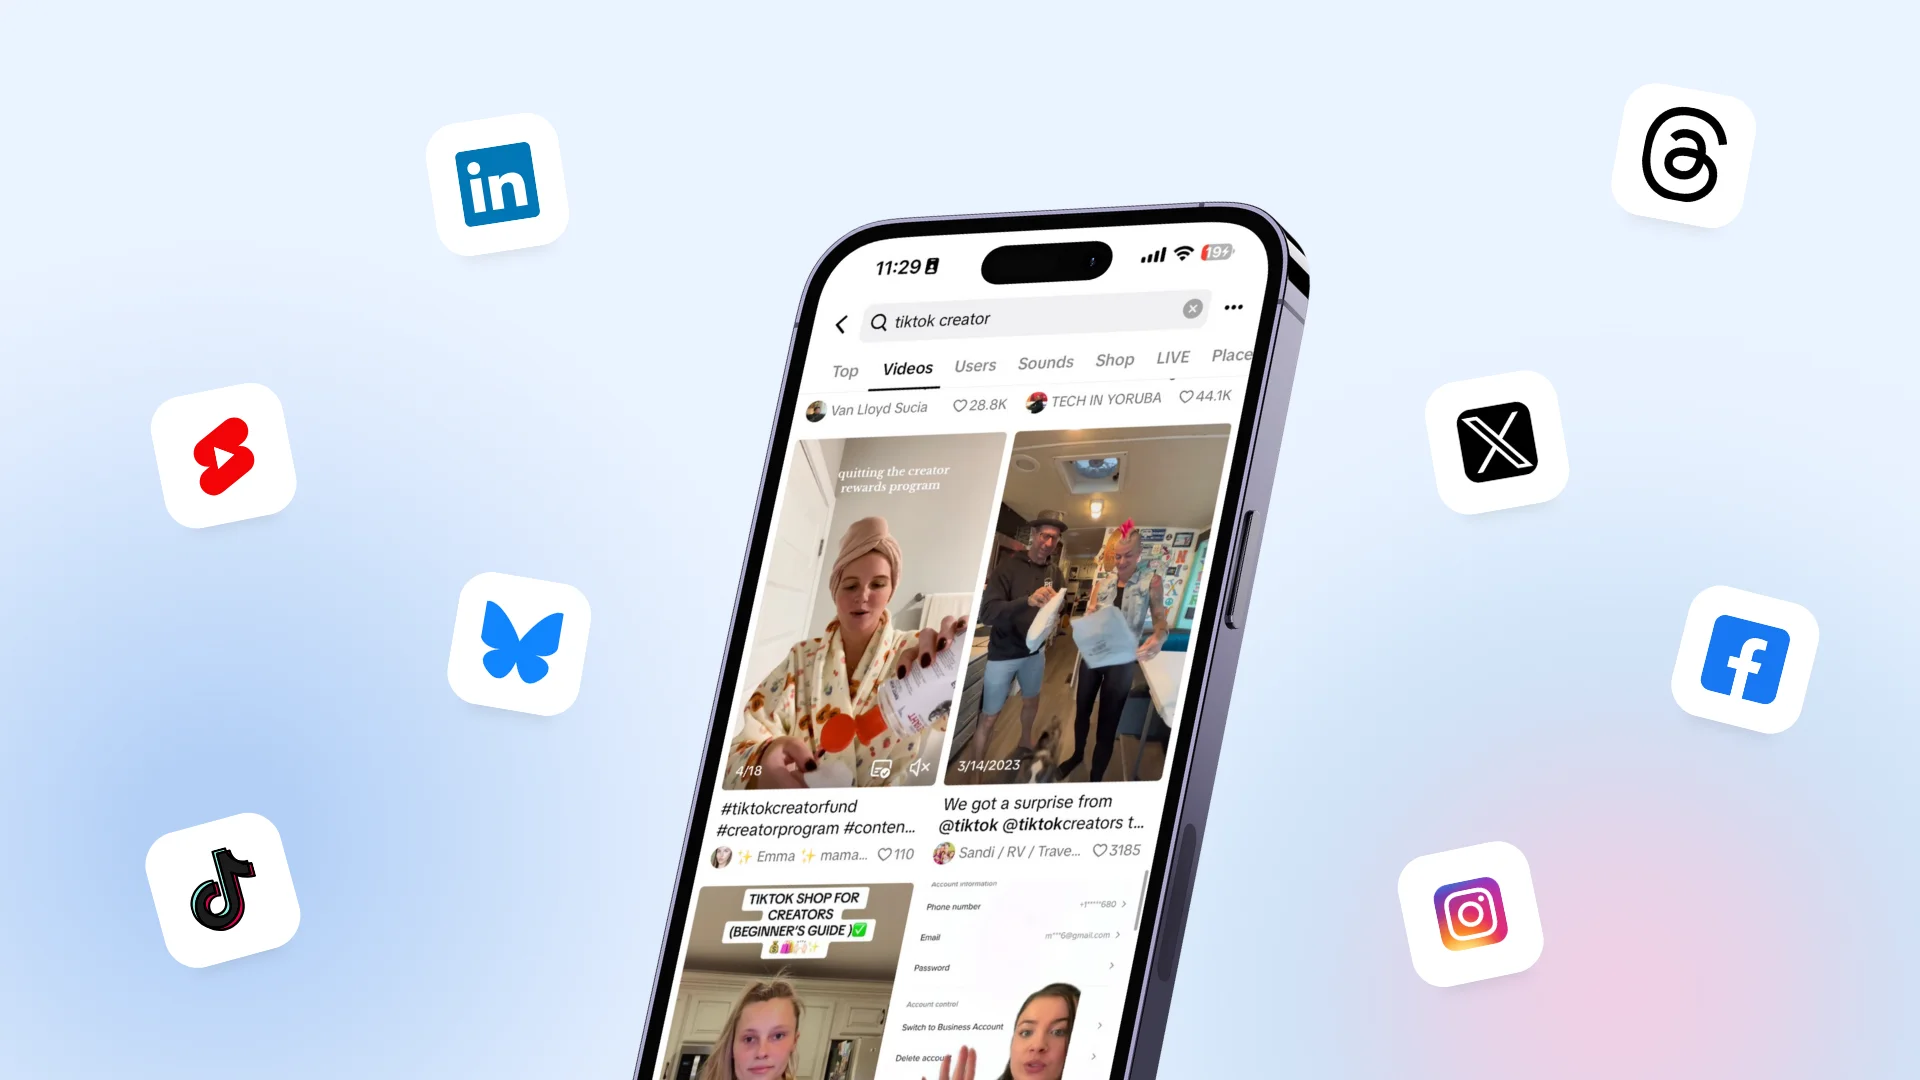
50 Unique Social Media Ideas for Consistent Content Creation
Discover 50 unique social media post ideas to engage your audience, grow your brand, and maintain a consistent content strategy with ease!
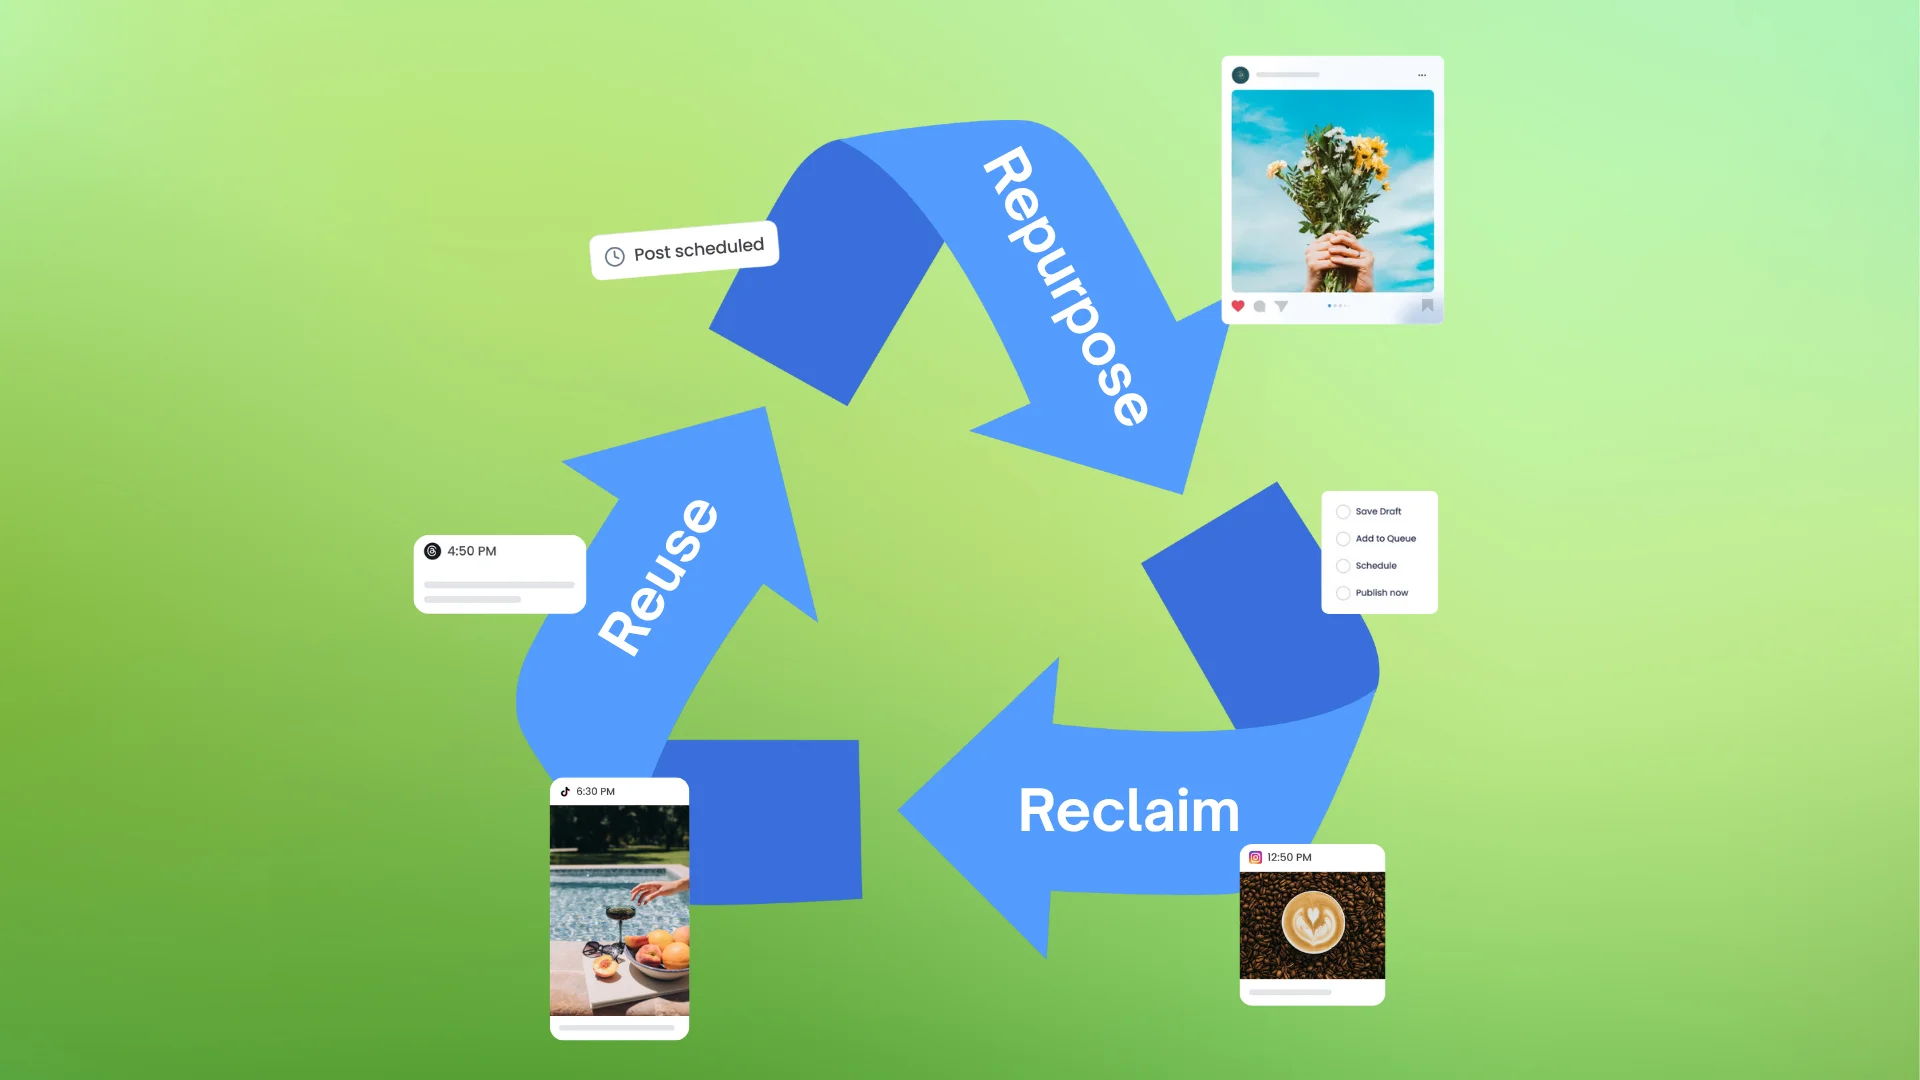
Mastering Content Reuse: The Key to a Consistent and Sustainable Posting Strategy

Published on January 19, 2026
13 min to read
Facebook Analytics: The Marketer’s Ultimate Guide

Summarize with AI


Table of Content
Imagine looking at your Facebook insights and seeing that engagement dropped 15% last month. More people are seeing your posts, but nobody is actually buying anything. Even worse, you’re gaining new followers, but half of them never like or comment on a single post. The numbers are right in front of you, but what do they actually mean?
Almost anyone can open a dashboard, but very few people know how to actually use the data. There is a huge difference between just staring at charts and knowing how to make them work for you.
With over 3 billion people on Facebook, the platform is still the best place to find customers, but if you don’t have a clear direction, you’re just wasting your budget.
This guide helps you interpret the data that matters for Facebook marketing, spot patterns before they become problems, and build strategies backed by evidence rather than assumptions.
Table of contents
Why Facebook analytics matter
Numbers without context are just noise. Facebook generates massive amounts of data about who sees your content, how they interact with it, and what drives them to do so.
The challenge isn’t accessing this data but knowing which metrics indicate performance and which just create the illusion of progress.
Understanding audience behavior
Demographics tell you who follows your page. Behavior tells you who actually cares. Facebook analytics reveal the gap between vanity metrics and meaningful engagement. A page with 50,000 followers but a 0.02% engagement rate has a visibility problem. One with 5,000 followers and 3% engagement has an audience.
Social media analytics expose which content formats resonate with specific segments. Video might perform exceptionally with 25-34 year-olds, while image carousels convert better with 45-54 year-olds. Without analytics, all you’re doing is guessing. With them, you’re optimizing.
Behavioral patterns emerge over time. If tutorial content consistently outperforms promotional posts by 400%, your audience is telling you something. Listen to the data, not your assumptions about what should work.
Proving ROI and justifying budget
Leadership wants proof that social spending drives business outcomes. “We posted 20 times this month” doesn’t cut it. Something more akin to “Our Facebook content generated 12,500 website visits, 890 leads, and $34,000 in attributed revenue” is what your team wants to hear.
Facebook analytics connect social activity to business results. Track clicks to landing pages, monitor conversion pixels, and measure engagement that correlates with purchase behavior. Social analytics tools aggregate this data into reports that demonstrate value rather than just activity.
Budget conversations shift when you can prove that $2,000 in ad spend generated $18,000 in revenue. Analytics transform social from “marketing overhead” to “revenue channel.”
Discovering what’s working
Successful campaigns don’t happen by accident. They’re identified early through performance indicators, then amplified strategically. Facebook analytics show which posts exceed baseline performance, which audience segments engage most, and which times generate peak activity.
Scaling the wrong content wastes money fast. A poorly performing ad that gets $5,000 in additional budget still performs poorly, just at a higher cost. Analytics help you recognize winners early and allocate resources accordingly.
Getting followers on Facebook becomes easier when you identify which organic posts drive follows, then create similar content systematically rather than hoping random posts gain traction.
Benchmarking against competitors
Operating in isolation means you don’t know if your 1.2% engagement rate is excellent or concerning. Industry context matters. Facebook engagement across industries ranges from 0.04% to 0.11%, with top performers reaching 0.15-0.25%.
If you’re hitting 1.2%, you’re crushing it. If you’re at 0.02%, there’s room for improvement. Competitor analysis reveals what’s possible within your category, showing whether your performance reflects execution issues or category-wide challenges.
Benchmarking also exposes opportunities. If competitors excel at video but you haven’t tested it, that’s a strategic gap worth exploring.
How to access Facebook analytics: 2 ways
You have two main options for accessing Facebook performance data: Facebook’s native Insights tool or third-party analytics platforms.
Native tools are free and built into your business page, making them the default choice for most marketers. Third-party platforms cost money but offer deeper analysis, automation, and cross-channel visibility.
The right choice depends on your reporting needs, team size, and how many accounts you manage.
Native Facebook Insights
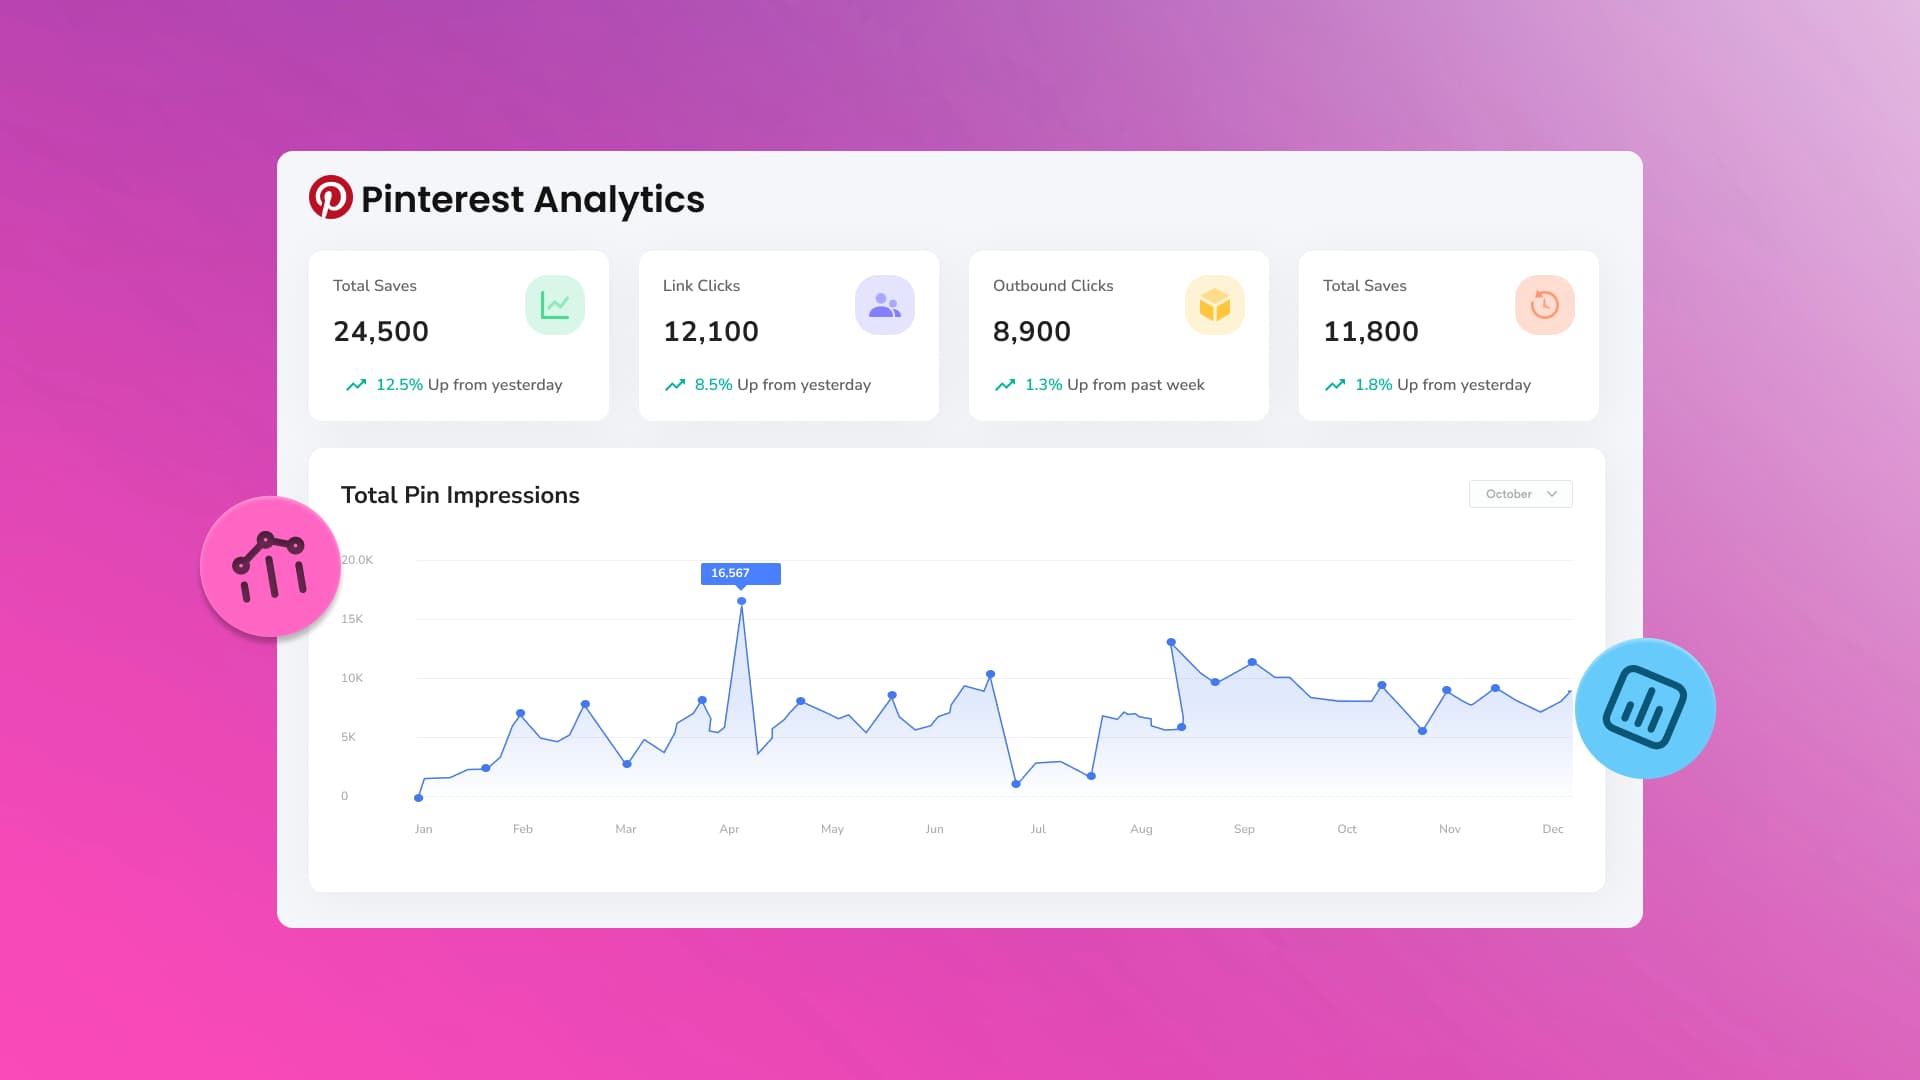
Facebook provides built-in analytics through Facebook Insights, accessible directly from your business page. The interface gives you baseline metrics for free, though depth and customization options are limited.
Follow these steps:
- Log into Facebook and navigate to your business page
- Click “Insights” in the left sidebar (if you have sufficient page permissions)
- Review the Overview dashboard showing recent performance highlights
- Navigate between tabs: Posts, Followers, People, Page Views, Actions on Page
- Use date range selectors to compare time periods
- Export data as Excel or CSV files for offline analysis
Facebook Insights works adequately for small pages with basic reporting needs. The interface updates several times annually, sometimes moving features or changing metric definitions without notice. Historical data access is limited, making long-term trend analysis difficult.
The tool also restricts multi-page analysis. If you manage multiple brands or locations, you’ll be switching between accounts constantly. No unified dashboard exists within Facebook’s native tools, and competitor analysis requires manual data gathering.
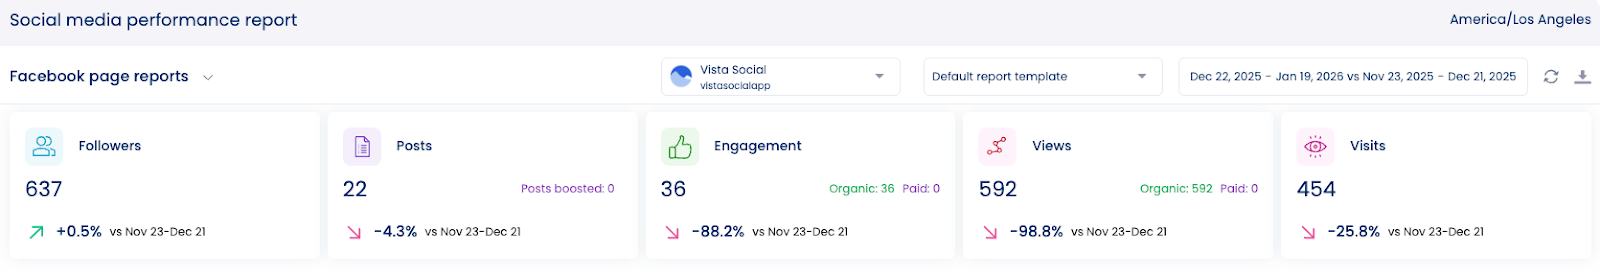
Vista Social’s Facebook analytics
Vista Social centralizes Facebook data alongside other social channels, providing cross-platform visibility and deeper analytical capabilities than native tools offer.
Follow these steps:
- Sign up for Vista Social and connect your Facebook page during onboarding
- Navigate to reports > Facebook from the main dashboard
- Access Post Performance Report for individual post metrics
- Review Social Media Performance Report for channel-wide trends
- Configure Competitor Analysis to benchmark against rival pages
- Set up automated reporting schedules for weekly or monthly delivery
- Use AI-powered insights to identify trends and opportunities
Vista Social maintains historical data indefinitely, enabling year-over-year comparisons and long-term trend analysis. The platform’s unified inbox consolidates Facebook comments, messages, and reviews alongside other channels, streamlining community management.
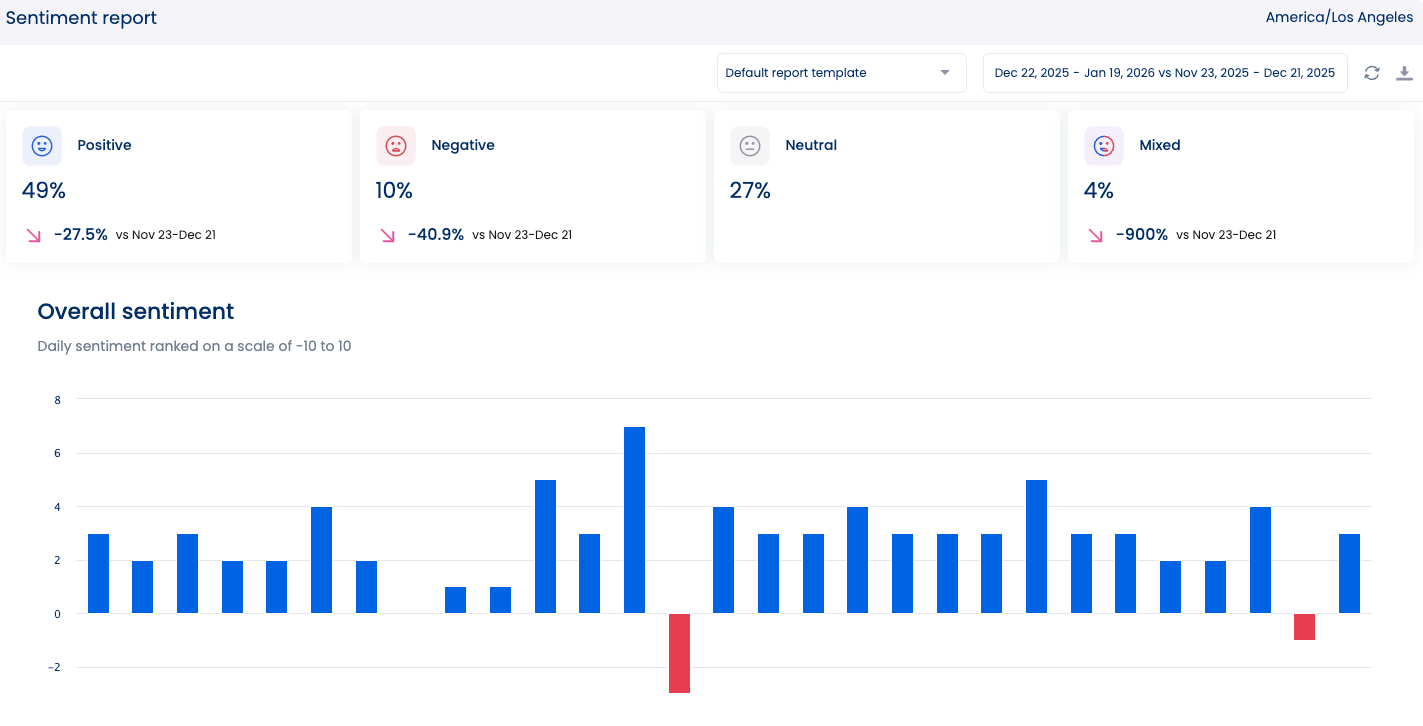
Sentiment analysis automatically categorizes audience reactions as positive, negative, or neutral. This saves hours of manual review while flagging potential issues before they escalate. Industry benchmarking shows how your performance compares to category averages without manual competitor research.
Team collaboration features let multiple users access the same reports, add comments, and share insights without downloading and emailing spreadsheets. White-label reporting removes Vista Social branding for agencies presenting to clients.
10 essential Facebook metrics to track
Facebook provides dozens of metrics, but most don’t matter for strategic decisions. Tracking everything creates analysis paralysis. Tracking nothing leaves you guessing. These ten metrics give you a complete picture of performance without drowning in data.
Total followers
Total followers represents your potential reach, the maximum audience size who might see organic content. This number matters for understanding scale, but growth without engagement indicates shallow interest.
Pages with 100,000 followers who never interact have less practical value than pages with 10,000 highly engaged followers. Total follower count impresses stakeholders but doesn’t necessarily drive business outcomes.
Consider these things to:
- Measure audience growth velocity
- Calculate engagement rate denominators (engagements divided by followers)
- Identify abnormal spikes or drops indicating algorithm changes or viral moments
- Set baseline expectations for organic reach potential
Vista Social tracks follower counts across all connected pages, making cross-brand comparison effortless. The platform flags unusual changes automatically, alerting you to potential issues worth investigating.
Follower growth rate
Follower growth rate measures how quickly your audience expands, typically expressed as a monthly percentage.
According to Social Status research, median Facebook follower growth rates by industry range from 0.5% to 2.5% monthly. Pages consistently exceeding 3% monthly growth are performing exceptionally well.
Tracking growth rate reveals:
- Whether current content strategy attracts new audience members
- How paid campaigns impact organic follower acquisition
- The compound effect of consistent content over time
Negative growth rates signal problems. If you’re losing more followers than you gain, content relevance or posting frequency needs adjustment. Vista Social’s growth tracking identifies exactly when follower counts shifted, letting you correlate changes with specific campaigns or content types.
Demographics
Demographic data shows who comprises your audience by age, gender, location, and language. This information should match your ideal customer profile. Misalignment indicates targeting problems or content that attracts the wrong audience.
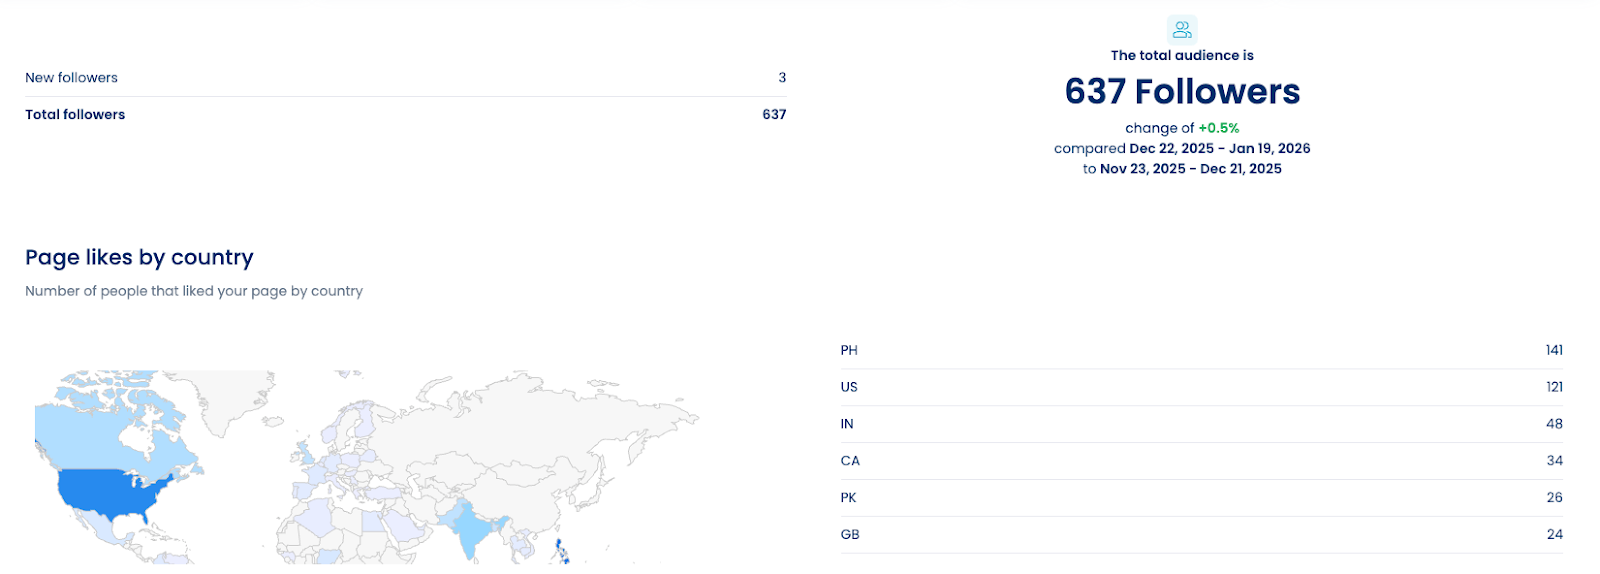
If you sell retirement planning services but your audience skews 18-24, you’re either marketing to the wrong demographic or creating content that appeals to non-buyers. Similarly, a local business shouldn’t have 60% of followers from another country unless international expansion is strategic.
Demographics inform:
- Content creation decisions (tone, references, format preferences)
- Posting time optimization based on audience time zones
- Ad targeting refinement for paid campaigns
Compare demographics quarterly. Shifts indicate an evolving audience or algorithm changes affecting content distribution. Vista Social overlays demographic data with engagement metrics, showing which segments interact most. This reveals whether your most engaged users match your target customer profile.
Reach
Reach counts unique users who saw your content, regardless of how many times they saw it. Organic reach depends on Facebook’s algorithm, which prioritizes content likely to generate engagement based on historical performance and user behavior patterns.
Average organic reach for Facebook posts has declined significantly. Most pages now reach only 5-10% of their followers organically, down from 15-20% in previous years. Paid promotion becomes necessary to reach larger audience percentages.
Track reach to:
- Understand actual content visibility versus potential (follower count)
- Identify high-performing posts that exceeded typical reach
- Recognize when algorithm changes affect distribution
- Calculate cost-per-impression for paid campaigns
Reach spikes indicate viral content or successful paid amplification. Sustained reach declines suggest content quality issues or audience fatigue. Vista Social’s reach tracking separates organic from paid, showing exactly what you’re getting from each investment.
Impressions
Impressions count total content views, including multiple views from the same user. If one person sees your post three times, that generates three impressions but only one reach.
High impressions with low engagement suggest content isn’t resonating despite visibility. Users are seeing it but not interacting. This happens when:
- Headlines or thumbnails don’t deliver on the promise
- Content quality disappoints expectations
- Messaging misaligns with audience interests
- Posting frequency creates banner blindness
Vista Social tracks impression trends alongside engagement, helping identify whether visibility or content quality drives performance changes.
Engagement
Engagement measures audience interaction through reactions, comments, shares, and clicks. This metric directly indicates content resonance and audience investment.
Calculate engagement rate as (Total engagements / Reach) × 100. This standardizes comparison across posts with different reach levels.
Try Vista Social for Free
A social media management platform that actually helps you grow with easy-to-use content planning, scheduling, engagement and analytics tools.
Get Started Now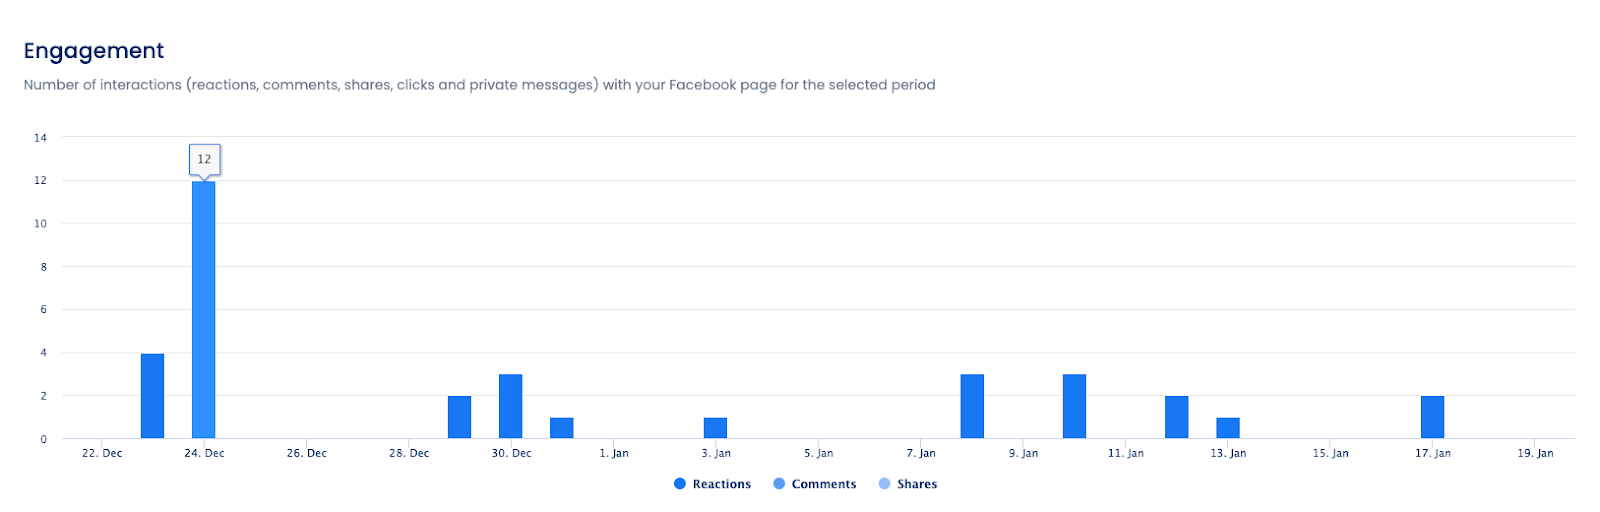
Different engagement types signal different things:
- Reactions: indicate emotional response but require minimal effort
- Comments: show deeper investment and create conversation opportunities
- Shares: extend reach to networks beyond your followers
- Clicks: demonstrate intent to learn more, moving users toward conversion
Track which content types generate which engagement forms. Educational content might generate saves. Controversial takes might generate comments. Inspirational content might generate shares. Understanding these patterns helps you create content matching specific campaign objectives.
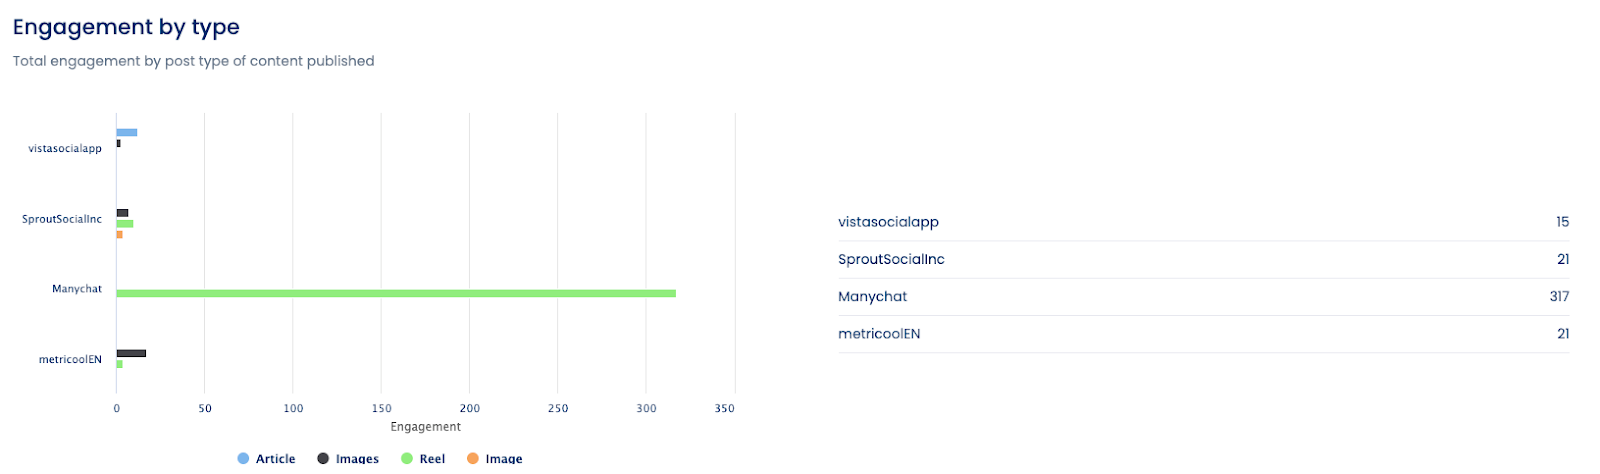
Vista Social’s engagement tracking breaks down performance by content type, posting day, and audience segment, revealing exactly what works for which groups.
Top posts
Top posts analysis identifies your highest-performing content, revealing patterns in what resonates with your specific audience. Sort by engagement rate rather than total engagements to account for reach differences.
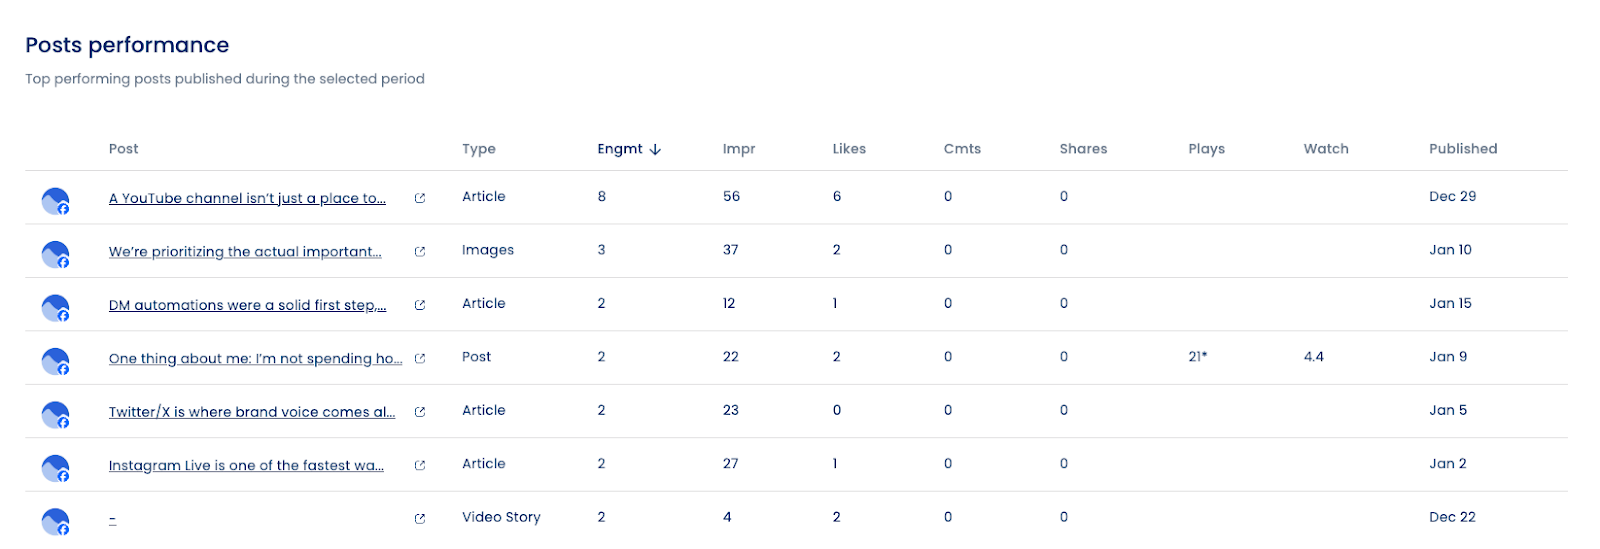
When analyzing top posts, look for:
- Content format patterns: Do videos outperform images? Do carousels beat single images?
- Topic themes: What subjects generate the most discussion?
- Posting time correlations: Do top posts share common publishing windows?
- Tone and voice: Does casual language outperform formal? Does humor work better than straight information?
Don’t fall into the habit of recreating top posts. Extract the underlying principles and apply them to new content. If “behind-the-scenes” content consistently performs well, that indicates audience interest in transparency and process, not just fascination with one specific behind-the-scenes post.
Brand awareness
Brand awareness measures how recognizable your brand is among target audiences. While difficult to quantify precisely, Facebook analytics provide proxy metrics indicating awareness trends.
Track these indicators:
- Direct page visits: Users typing your page URL or searching by name
- Branded search volume: External tools like Google Trends show search interest
- Share of voice: Your mentions relative to competitors in your space
- Aided vs. unaided recall: Survey data showing who remembers your brand
Vista Social’s sentiment analysis and share of voice tracking provide ongoing awareness indicators without requiring expensive brand studies. Monitor whether your brand gets mentioned more frequently over time and whether sentiment trends positive, neutral, or negative.
Increased awareness should correlate with follower growth and direct traffic increases. If awareness metrics rise but these tangible outcomes don’t follow, awareness isn’t converting to interest.
Competitor analysis
Understanding competitor performance contextualizes your results. A 2% engagement rate looks different if competitors average 1% versus if they average 4%.
Competitor analysis reveals:
- Content strategies working in your space: What formats do top performers use?
- Posting frequency benchmarks: How often do successful pages publish?
- Engagement tactics: Do competitors excel at community management?
- Paid strategy indicators: Sudden reach spikes suggest paid amplification
Select 3-5 direct competitors and 2-3 aspirational brands (larger accounts you want to emulate). Track their:
- Follower growth trajectories
- Posting frequency and timing
- Content mix (video vs. image vs. text)
- Engagement rates by content type
- Audience demographics (when visible)
Don’t copy competitors. Learn from their successes and failures to inform your strategy. If a competitor’s video series generates exceptional engagement, test your own video content rather than recreating theirs.
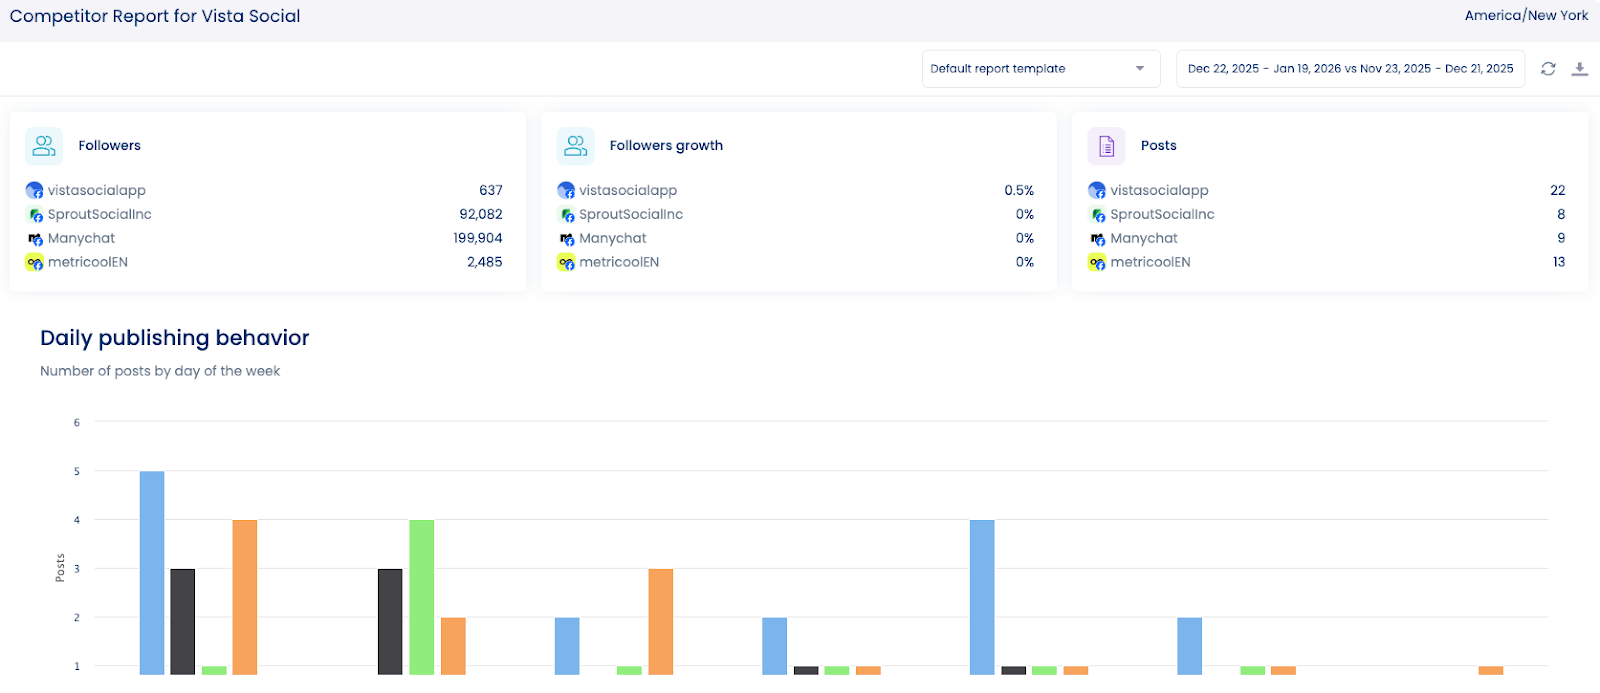
Vista Social automates competitor tracking, updating metrics daily without manual data gathering. The platform flags significant changes like viral posts or engagement rate shifts, alerting you to tactics worth investigating.
Paid performance
Paid performance metrics measure advertising effectiveness and ROI. Even pages focusing on organic reach benefit from occasional paid amplification to boost high-performing content or accelerate growth.
Key paid metrics:
Cost per result: What you pay per desired action (click, conversion, lead, etc.) Return on ad spend (ROAS): Revenue generated divided by ad cost Frequency: How many times each person sees your ad Relevance score: Facebook’s assessment of ad quality and audience match Cost per thousand impressions (CPM): What you pay per 1,000 ad views Click-through rate (CTR): Percentage of ad viewers who click
According to WordStream’s 2024 benchmarks, the average Facebook ad CTR is 0.89%, with CPCs ranging from $0.50 to $2.00 depending on industry and competition.
Track paid performance to:
- Identify which creative performs best before scaling the budget
- Recognize when frequency becomes excessive (above 3-4 impressions per person)
- Calculate true customer acquisition costs including ad spend
- Compare paid performance against organic to optimize budget allocation
Vista Social’s paid performance tracking integrates with Facebook Ads Manager, pulling campaign data automatically.
Poor paid performance usually indicates targeting misalignment, creative quality issues, or offer/product-market fit problems rather than platform ineffectiveness.
Best practices for using Facebook analytics to guide your strategy
Pulling up your analytics dashboard is the easy part. Using that data to make better decisions is where things get tricky. These best practices help you move from staring at numbers to improving results.
Track metrics aligned to actual business goals
Vanity metrics feel good but don’t drive outcomes. If your goal is brand awareness, track reach, impressions, and share of voice. If it’s lead generation, focus on click-through rates, landing page conversions, and cost per lead. If it’s community building, measure comment rates, response times, and sentiment.
Businesses that align social metrics with specific business objectives will see better results than those tracking generic “engagement.”
Create a metric hierarchy:
- Primary metrics: Directly reflect goal achievement (conversions, revenue, qualified leads)
- Secondary metrics: Leading indicators of primary success (CTR, engagement rate, reach)
- Tertiary metrics: Contextual information (demographics, competitor performance)
Review primary metrics weekly. Secondary metrics inform tactical adjustments. Tertiary metrics provide strategic context quarterly.
Vista Social’s customizable dashboards let you prioritize metrics matching your goals, hiding irrelevant data that distracts from what matters.
Optimize posting times based on actual audience behavior
Generic advice says, “Post at 1 PM on Wednesdays.” Your audience might be most active at 8 AM on Saturdays. Best times to post on Facebook vary dramatically by audience demographics, industry, and content type.
Facebook Insights shows when your followers are online by day and hour. This data reveals optimal windows for posting. Vista Social analyzes historical performance based on when your specific audience engages most.
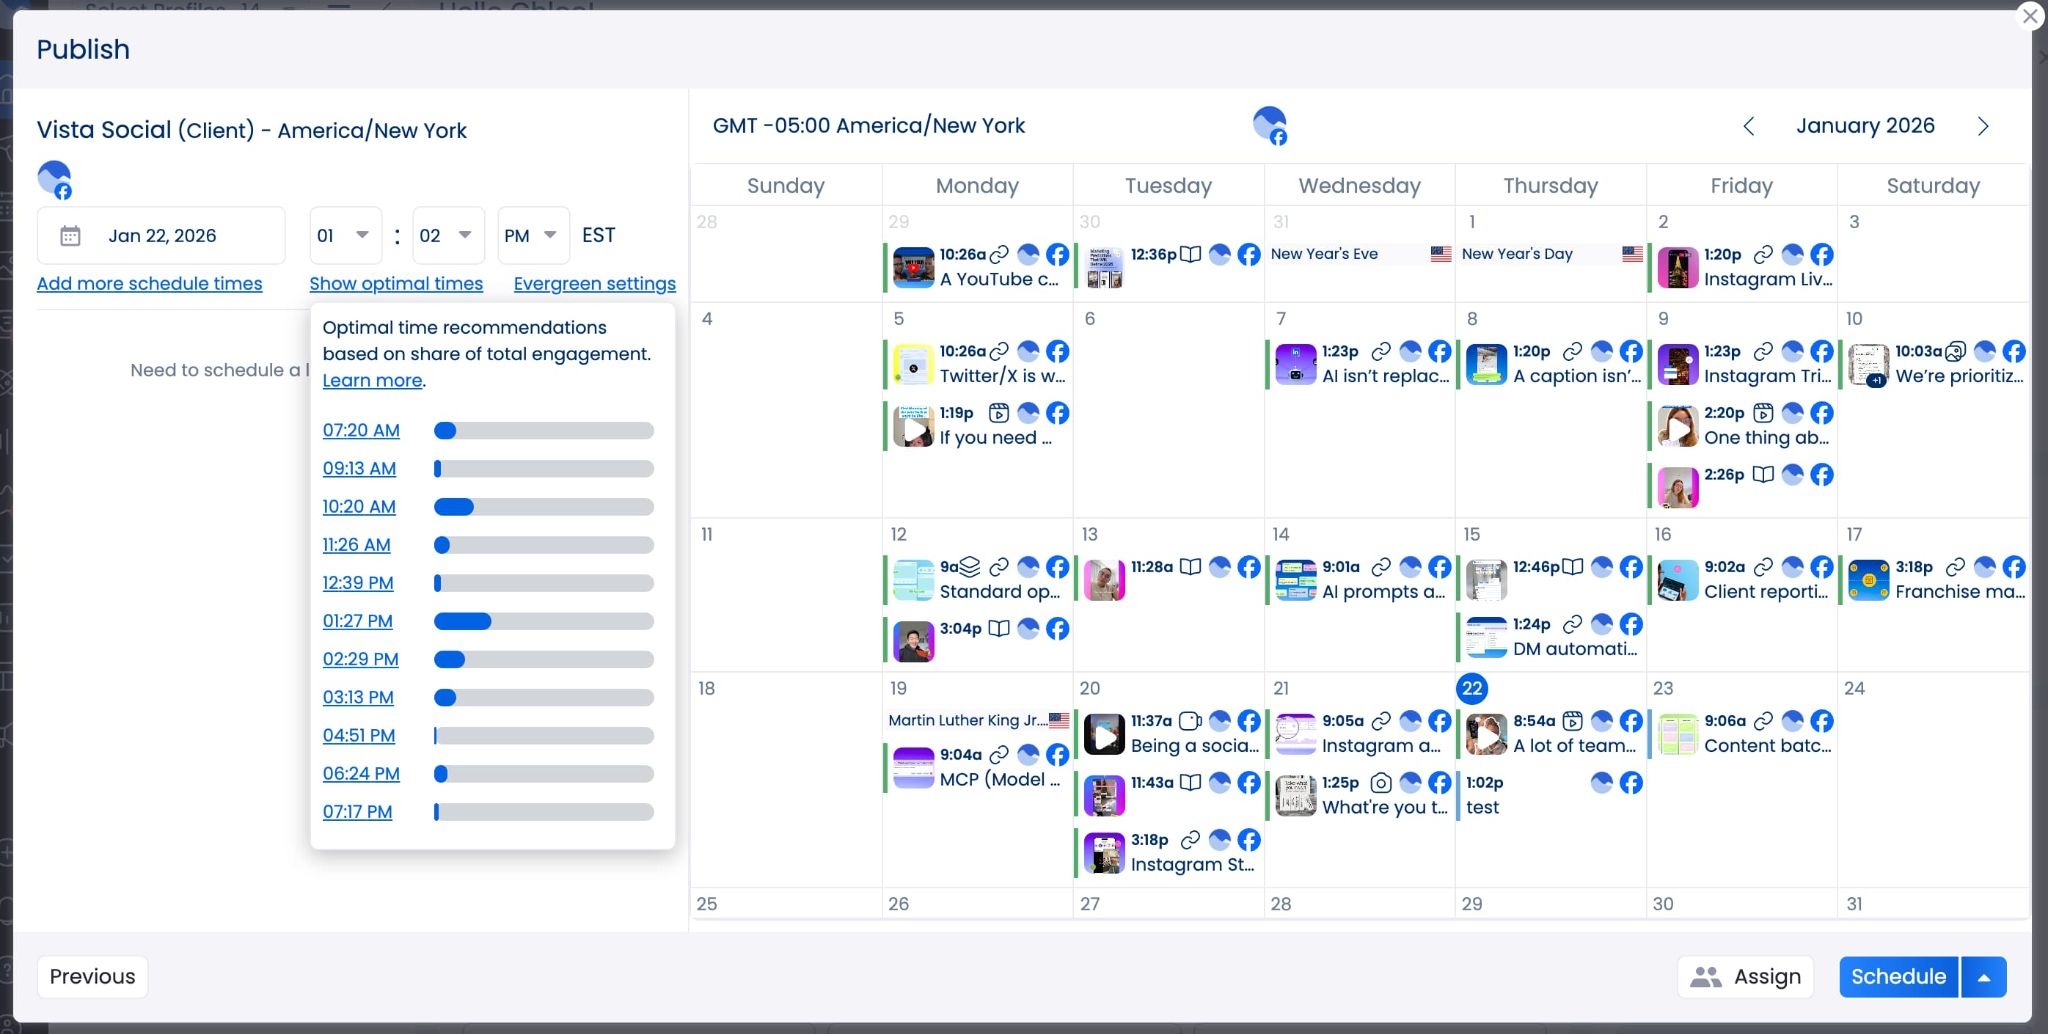
Don’t just follow generic online guides for “best time to post on X,” for example. Track performance on your own content, then adjust your publishing calendar accordingly. Reevaluate this quarterly as audience behavior and platform algorithms evolve.
Compare cross-platform and competitor performance
Facebook performance exists within a broader context. How does your Facebook engagement compare to Instagram? Are competitors outperforming you on Facebook while you dominate LinkedIn? Cross-platform and competitive analysis reveals strategic opportunities.
Vista Social’s unified analytics dashboard shows performance across all connected channels, making comparison effortless. You might discover that video content crushes on TikTok but underperforms on Facebook, suggesting platform-specific content strategies rather than universal approaches.
Competitor benchmarking identifies gaps and opportunities. If rivals excel at video but you haven’t invested in that format, that’s a potential growth area. If you’re crushing everyone on engagement rate despite smaller follower counts, double down on what’s working while they chase vanity metrics.
Use tools that actually streamline data collection
Native Facebook Insights requires manual export, offline analysis, and manual competitor research. This works for tiny accounts. It doesn’t scale. Third-party tools automate data collection, analysis, and reporting, saving hours while providing deeper insights.
Vista Social consolidates Facebook analytics alongside other channels, eliminates manual exports, and automates competitor tracking. The platform’s AI-generated insights flag trends and anomalies without requiring you to spot patterns manually in spreadsheets.
Build and review reports on a consistent schedule
Analytics inform decisions when reviewed regularly, not quarterly after problems compound. Establish reporting cadences matching your needs:
- Weekly: Tactical optimization (what to post, when to post, budget reallocation)
- Monthly: Performance against goals, trend identification, team updates
- Quarterly: Strategic planning, competitive positioning, budget discussions
Vista Social’s automated reporting sends scheduled reports to designated recipients without manual intervention. Set it once to receive insights continuously. This ensures stakeholders stay informed and you catch issues early.
Start analyzing your Facebook presence today
The difference between pages that grow and those that stagnate isn’t content quality alone. It’s the discipline to measure what works, double down on winners, and cut losers quickly.
Platforms like Vista Social centralize Facebook data alongside other channels, automate competitor tracking, and generate AI-powered insights. It replaces scattered spreadsheets with unified dashboards, saving hours while delivering better strategic intelligence.
The brands winning on Facebook aren’t posting more. They’re measuring better, learning faster, and adapting quicker. Analytics give you the feedback loop that separates growth from stagnation. Try Vista Social today to up your analytics game and see growth faster with fewer headaches when looking at your data.
Facebook analytics FAQs
What is Facebook analytics?
Facebook analytics refers to the data and metrics measuring your page’s performance, audience behavior, and content effectiveness. This includes engagement rates, reach, follower growth, demographics, and conversion tracking.
Modern Facebook analytics happens primarily through Facebook Insights (the native tool) and Meta Business Suite, which replaced the discontinued standalone Facebook Analytics product in 2021. Third-party platforms like Vista Social extend native capabilities with cross-platform comparison, automated reporting, and competitor analysis.
How do you see your Facebook analytics?
Access Facebook analytics by navigating to your business page and clicking “Insights” in the left sidebar. The Insights dashboard shows overview metrics, post performance, follower demographics, and engagement trends.
For more comprehensive analysis, connect your Facebook page to Vista Social or similar analytics platforms. These tools aggregate data from multiple sources, provide historical tracking beyond Facebook’s limited retention, and offer features like sentiment analysis and competitive benchmarking that native tools lack.
Does Facebook analytics show who viewed your page?
No. Facebook’s privacy policies prevent page owners from seeing individual visitor identities. You receive aggregated demographic data (age ranges, genders, and locations) when sufficient users visit but cannot track specific people.
The page views metric shows total visits and unique visitors, but without identifying information. This protects user privacy while still providing actionable audience insights for content optimization.
About the Author

Content Writer
Orion loves to write content that refuses to be boring. As part of Vista Social, he helps brands, creators, and agencies stop doom scrolling and start winning with social media. When he's not in front of a keyboard, he's watching films in IMAX with his wife, dissecting football tactics (the European kind), and getting lost in a good book.
Read with AI
Save time reading this article using your favorite AI tool
Summarize with AI
Never Miss a Trend
Our newsletter is packed with the hottest posts and latest news in social media.


You have many things to do.
Let us help you with social media.
Use our free plan to build momentum for your social media presence.
Or skip ahead and try our paid plan to scale your social media efforts.
P.S. It will be a piece of cake 🍰 with Vista Social

Subscribe to our Newsletter!
To stay updated on the latest and greatest Social Media news. We promise not to spam you!


Tools
PublishingAnalyticsEngagementIntegrations
FacebookInstagramLinkedInSnapchatThreadsTikTokX (Twitter)YouTubeBlueskyVista Page (link-in-bio)All IntegrationsCopyright © 2026 Vista Social LLC. All Rights Reserved.