


Published on August 15, 2025
12 min to read
Cross‑Platform Analytics Benchmarking: Compare Your Social Channels

Summarize with AI


Table of contents
Summarize with AI

ChatGPT

Claude

Perplexity
Share

Vista Social

X (Twitter)


Cross-platform analytics benchmarking might sound intimidating, but if you’re managing multiple social channels, think of it as your new secret weapon.
Be honest—keeping track of performance on just one platform is already a challenge, right?
Now imagine comparing Facebook to Instagram, TikTok to LinkedIn… without losing your sanity (or your data).
That’s exactly where cross-platform analytics benchmarking comes in.
It lays everything out side by side, so you can instantly see how each channel is doing.
From there, it’s simple: double down on what’s working, fix what’s not, and finally stop guessing.
I’ll break it down in plain English and show you how to use benchmarking to sharpen your strategy—and prove ROI to your clients like a pro.
Table of contents
What you will learn
- What is cross platform analytics benchmarking?
- Why is cross platform analytics benchmarking important?
- How does cross platform analytics benchmarking work?
- Simplify cross platform analytics benchmarking with Vista Social
- Key metrics to track for cross platform analytics benchmarking
- What to consider before implementing cross platform analytics benchmarking
- FAQs on cross platform analytics benchmarking
- Ready to level up your cross platform analytics benchmarking?
What is cross platform analytics benchmarking?
Cross-platform analytics benchmarking is the process of comparing performance metrics across various social media channels such as Instagram, Facebook, X (formerly Twitter), LinkedIn, and TikTok, to see how each one stacks up.
Must read: 10 Facebook Analytics Tools Used by Top Marketing Agencies
Instead of looking at each platform’s performance in a silo, benchmarking gives you a side-by-side view of key data points, such as
- Engagement rates
- Follower growth
- Reach and impressions
- Click-throughs and conversions
A cross-platform view helps you understand which channels drive the best results, where to focus efforts, and how performance compares to your clients’ industries or competitor standards.
Why is cross platform analytics benchmarking important?
Multi-platform analytics benchmarking is a game-changer for the following reasons.
Gives a side-by-side performance view
Instead of hopping between native analytics on Instagram, Facebook, TikTok, and LinkedIn, cross‑platform benchmarking brings all your key metrics into one view.
Must read: 15 TikTok Analytics Tools Worth Trying this 2025
It lets you compare performance across channels consistently while getting a clean, high-level look at what’s driving results (and what’s not).
Helps identify top performing channels
Not every social media platform performs the same, and that’s okay!
Benchmarking helps you quickly figure out which of your clients’ channels are your heavy hitters when it comes to engagement, reach, traffic, or conversions.
That way, you can celebrate what’s working and spend less time guessing where to put your energy and resources.
Improves resource allocation
Benchmarking is crucial because it can help you determine where to invest your time and budget to get the best results.
For instance, if LinkedIn is crushing it with high-value leads, but X is falling flat, you can shift your focus accordingly.
It’s all about doing more with less and doing it smarter.
Ensures smarter goal setting
With benchmarks in place, you can stop setting vague goals such as “grow engagement” and start going for specific targets like “increase Instagram engagement rate by 10% in Q3.”
Benchmarking across different platforms gives you a performance baseline to track progress and celebrate actual wins, rather than just activity.
Simplifies reporting and proves value
Nothing says “I know what I’m doing” like a clear performance comparison across social media platforms.
Cross‑platform benchmarking lets you present clean visuals and simple takeaways that showcase your impact without the tech jargon.
Reveals content and audience insights
Benchmarking across social media channels shows you what types of content are resonating where.
For example, your client’s video posts can be killing it on Snapchat or TikTok but barely make a dent on Facebook.
Must read: Snapchat Analytics Ultimate Guide: What to Track, FAQs, Etc.
These insights can help you tailor content to fit each audience, instead of applying a one-size-fits-all approach that doesn’t help with boosting engagement.
Tracks progress over time
A single snapshot is helpful, but trends are even more powerful.
Benchmarking across specific periods lets you track whether your strategy, including influencer collaborations and other social media marketing campaigns, is improving, staying flat, or needs a pivot.
Must read: 13 Influencer Analytics to Boost Your ROI (Free & Paid)
It can help you turn day-to-day data into long-term growth stories and, in turn, achieve social media marketing success for your clients.
Stays competitive with industry benchmarks
Want to know how your clients’ social media pages are doing compared to others in their niches?
Many social media analytics tools allow you to compare your clients’ performances against industry benchmarks.
Must read: 20+ Social Analytics Tools in 2025: Free And Paid
Comparing your clients’ social media performance against industry benchmarks helps you set realistic expectations, identify gaps, and stay ahead of the curve.
How does cross platform analytics benchmarking work?
While cross-platform analytics benchmarking processes can vary depending on the goals, strategy, and campaigns, there are essential steps you can follow to ensure effective and seamless analysis.
1. Collect data across platforms
The first step in cross-platform analytics benchmarking (or any analytics process) is to gather all the essential performance metrics from every social channel where your clients are active.
That includes likes, comments, shares, saves, reach, impressions, follower growth, click-through rates, and more.
Each platform tracks these a little differently, so it’s important to pull a full picture.
Manually doing this can be a total time-suck, but take the load off by using a cross-platform analytics tool that automatically collects and organizes all this data into one clean, easy-to-read dashboard.
No more tab-hopping or spreadsheet chaos, just insights, all in one place.
2. Standardize your metrics
Here’s where things get real: Instagram may call it “engagement,” Facebook may break it into “likes and reactions,” and TikTok has its own vibe entirely.
Standardizing your metrics means translating all these various data and metrics formats into a common language so you can actually compare them.
For example, instead of comparing raw likes, you may use engagement rate (interactions divided by reach or followers) to level the playing field.
The step turns your data into apples-to-apples comparisons, so you’re not judging TikTok by Instagram rules, and you get the right data insights.
3. Compare performance side by side
Now that your metrics are speaking the same language, it’s time to do the fun part—comparison!
Lay out each platform’s performance next to the others to see which one’s pulling its weight.
Is your client’s Instagram crushing it on engagement?
Is their LinkedIn quietly driving conversions?
Must read: LinkedIn Analytics: Complete Guide [w/ metrics, tools, etc.]
Maybe TikTok’s follower growth is skyrocketing, but click-throughs are flat.
Comparing platform performance side by side helps you spot what’s working, what needs love, and where to focus your energy for maximum impact.
Think of it like a leaderboard for your social media strategy.
4. Use benchmarks for setting goals
Finally, give your numbers some context.
Look at industry benchmarks (or even your clients’ own past performances) to see how they’re really doing.
Are your clients’ Instagram engagement rates above average for their niches?
Is their Facebook reach lagging compared to last quarter?
These insights help you set realistic, data-backed goals, such as improving reach by 20% or doubling click-throughs in three months.
It’s not just about tracking numbers, but turning those numbers into action and making steady progress that leads to social media success.
Simplify cross platform analytics benchmarking with Vista Social
If you’ve ever tried to compare analytics across multiple social platforms, you know that the struggle is VERY real.
One platform gives you reach, another gives you engagement, a third gives you… something vaguely called “insights.”
Making sense of it all can feel like you need a translator, a spreadsheet, and several hours of your life you’ll never get back.
This is where Vista Social steps in to make things way easier for you and your team.
Instead of logging into five platforms to gather your numbers, Vista Social brings all your clients’ social media analytics into one sleek dashboard.
Whether you’re tracking your clients’ Facebook engagement, Instagram reach, LinkedIn clicks, or TikTok growth, you can view it all side by side with Vista Social—no mental gymnastics required.
Must read: 15 LinkedIn Analytics Tools to Boost Your Marketing ROI
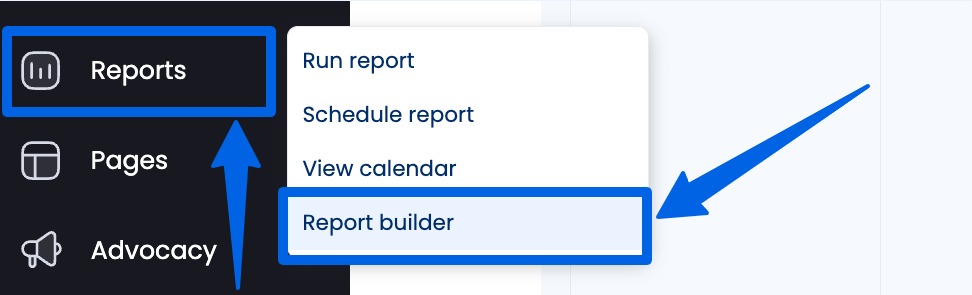
After logging into your Vista Social account, click Reports on the main menu (left side) and select Run report.
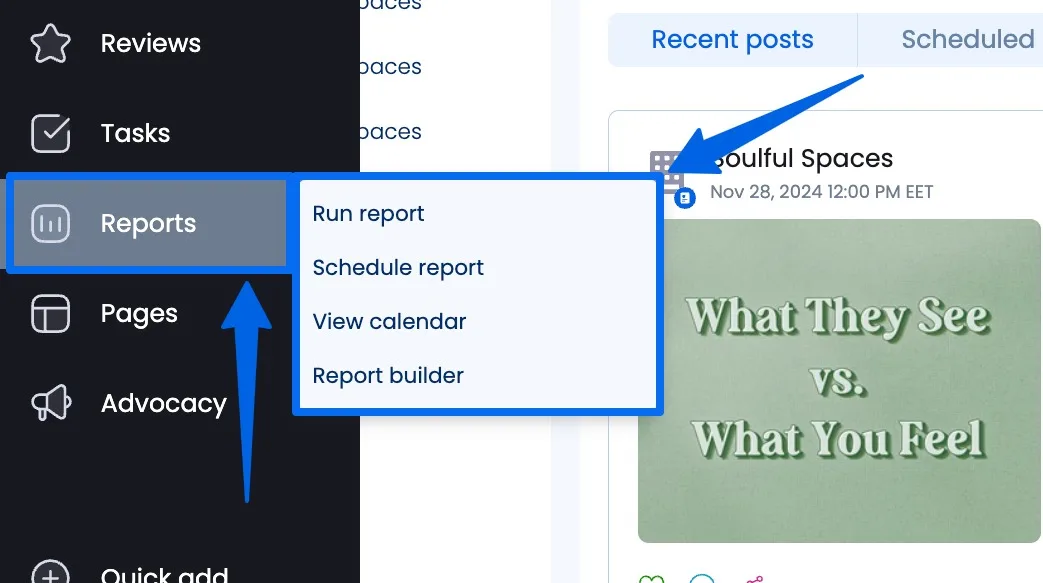
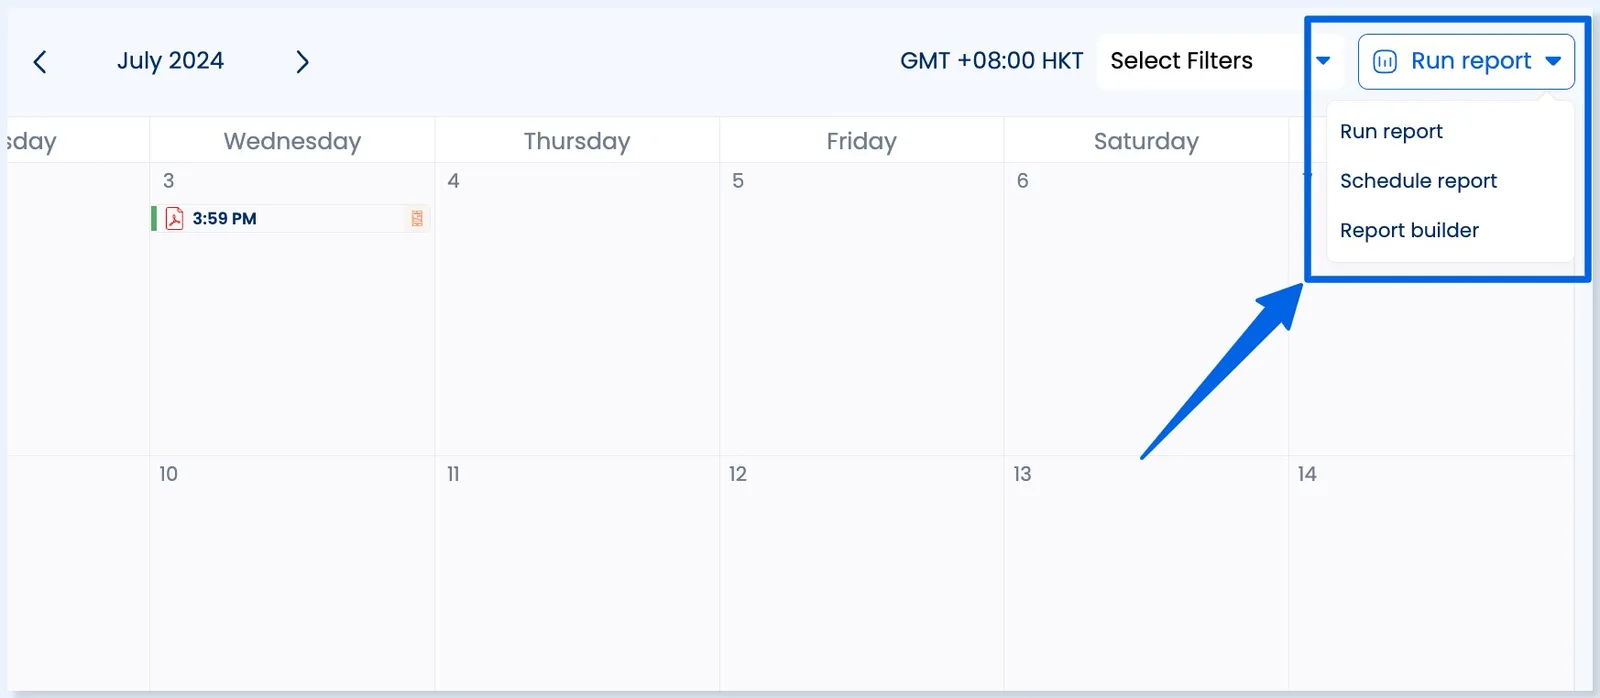
On the top right corner, click the Run report button, and you can choose Run report, Schedule report, or Report builder.
Select Run report for now.
Select your report type.
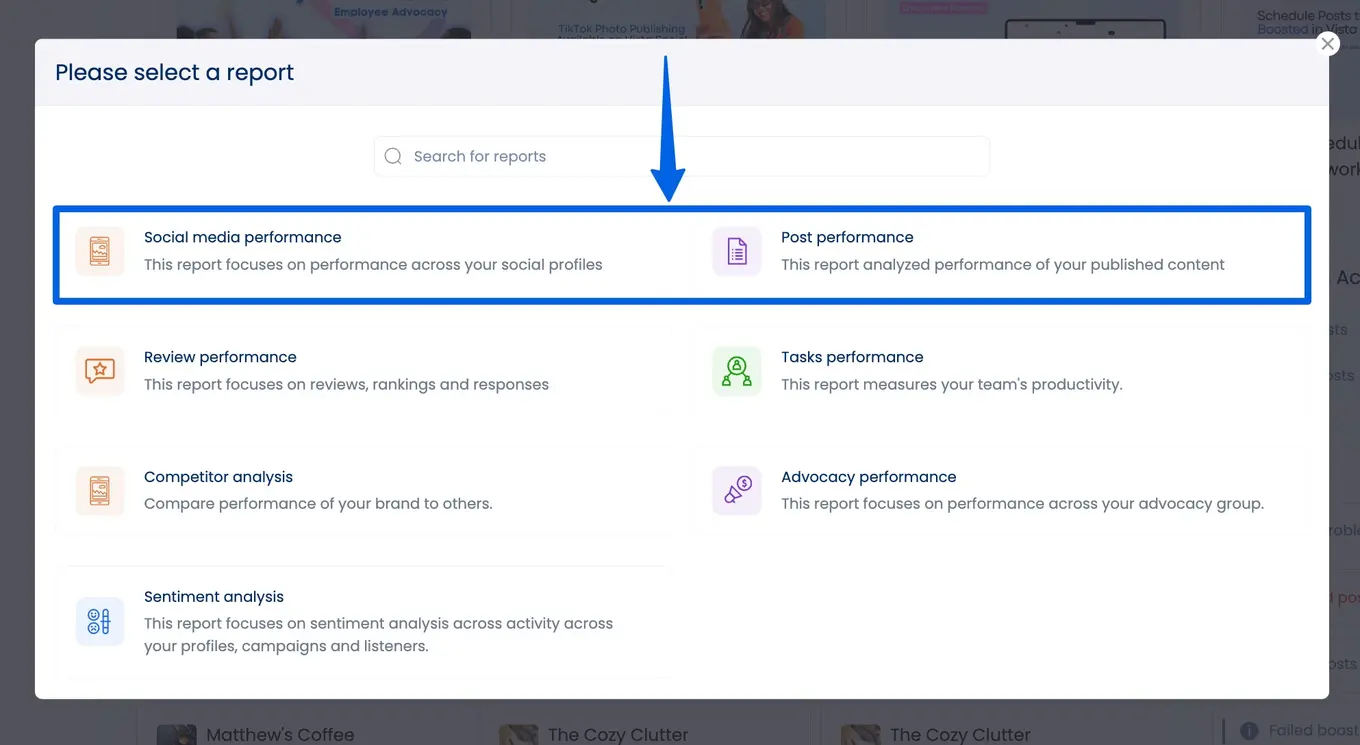
Vista Social offers several reports that provide cross-platform analytics benchmarking insights: Social Media Performance Report, Post Performance Report, Competitor Analysis Report, and Industry Benchmark Report.
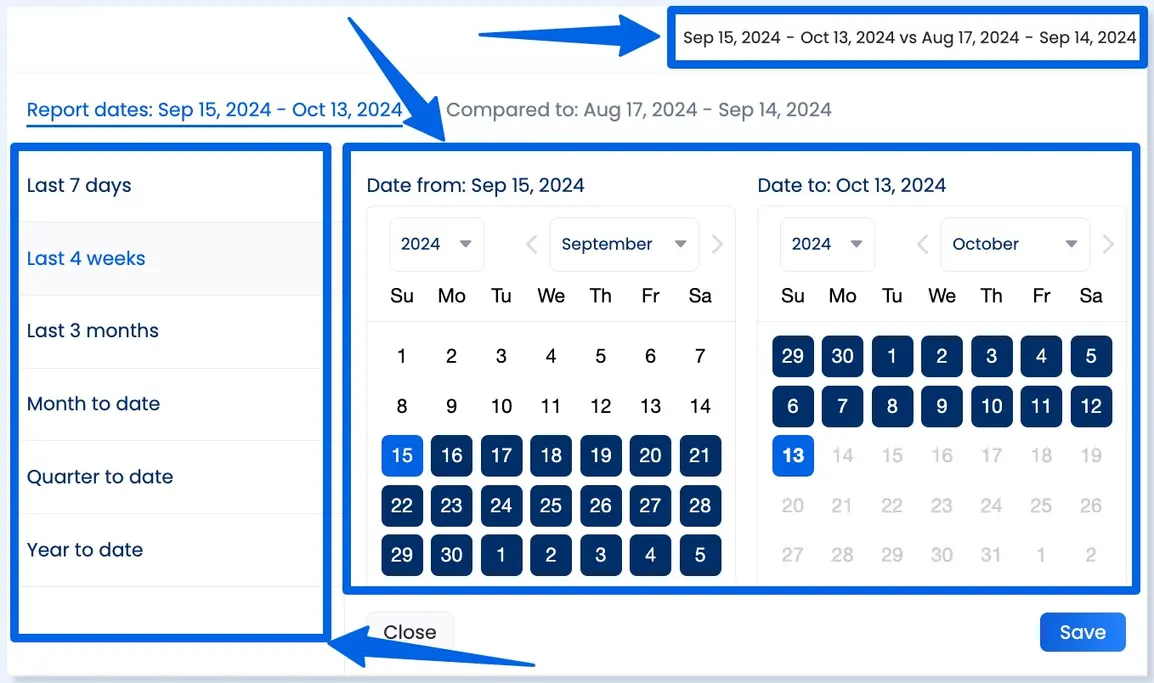
After choosing your report type, specify the date range.
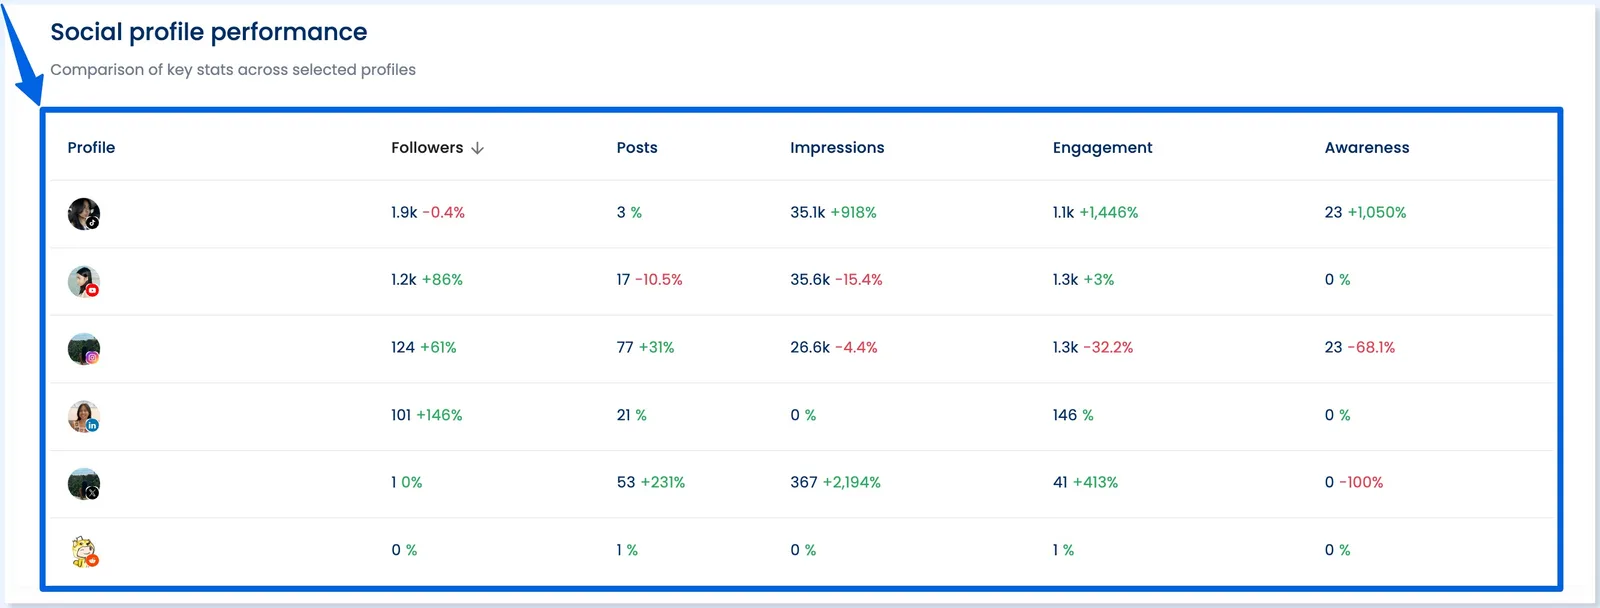
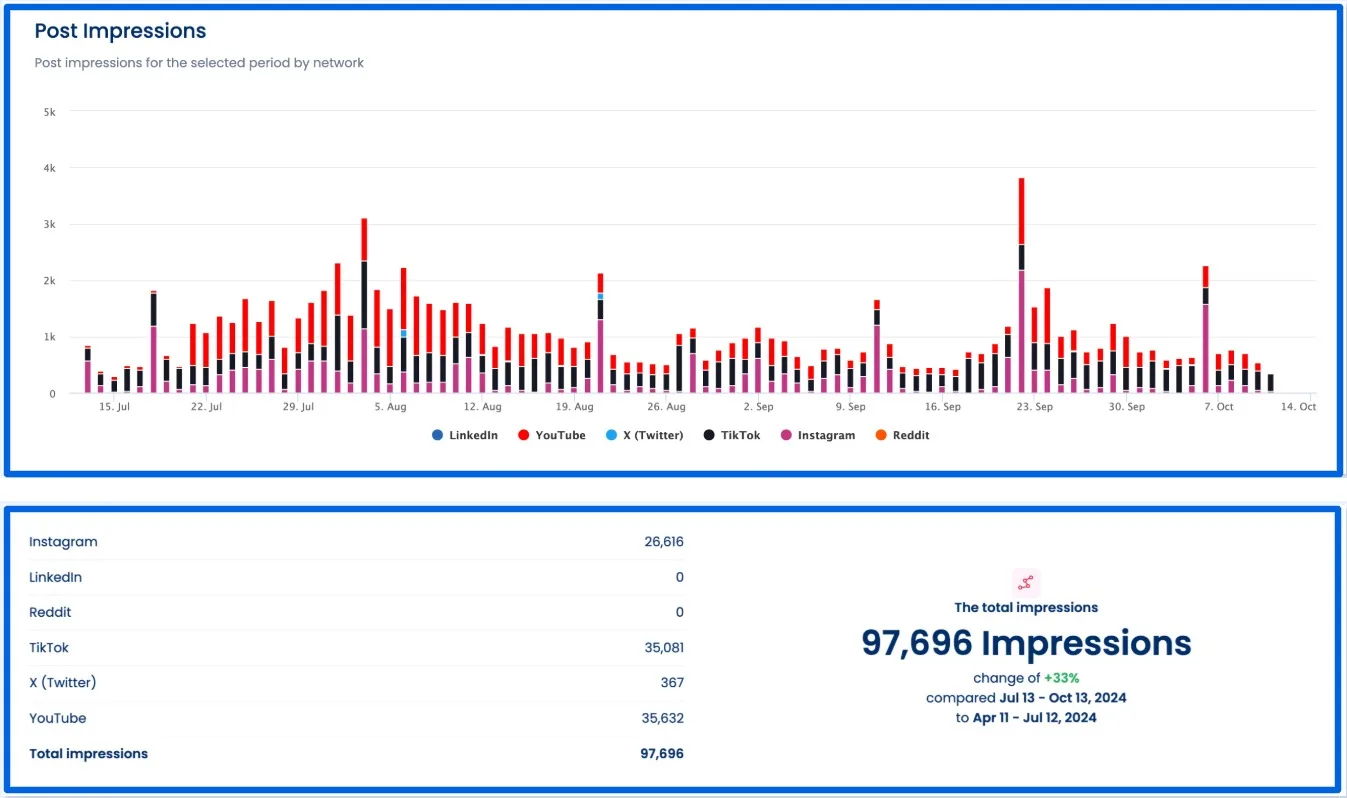
The Social media performance report tracks key cross-platform analytics metrics, including the following.
- Social profile performance
- Daily engagement by network
- Total fans and total engagement across social networks
- The number of published posts per network
- Brand awareness, including any mentions, shares, and messages per network
- Post impressions by network
- Number of interactions generated by hashtags across your social media posts
Must read: Hashtag Analytics Guide: With Tips, Tools, and Strategies
The best part? You can schedule your reports to generate and share at a specific time and date automatically.
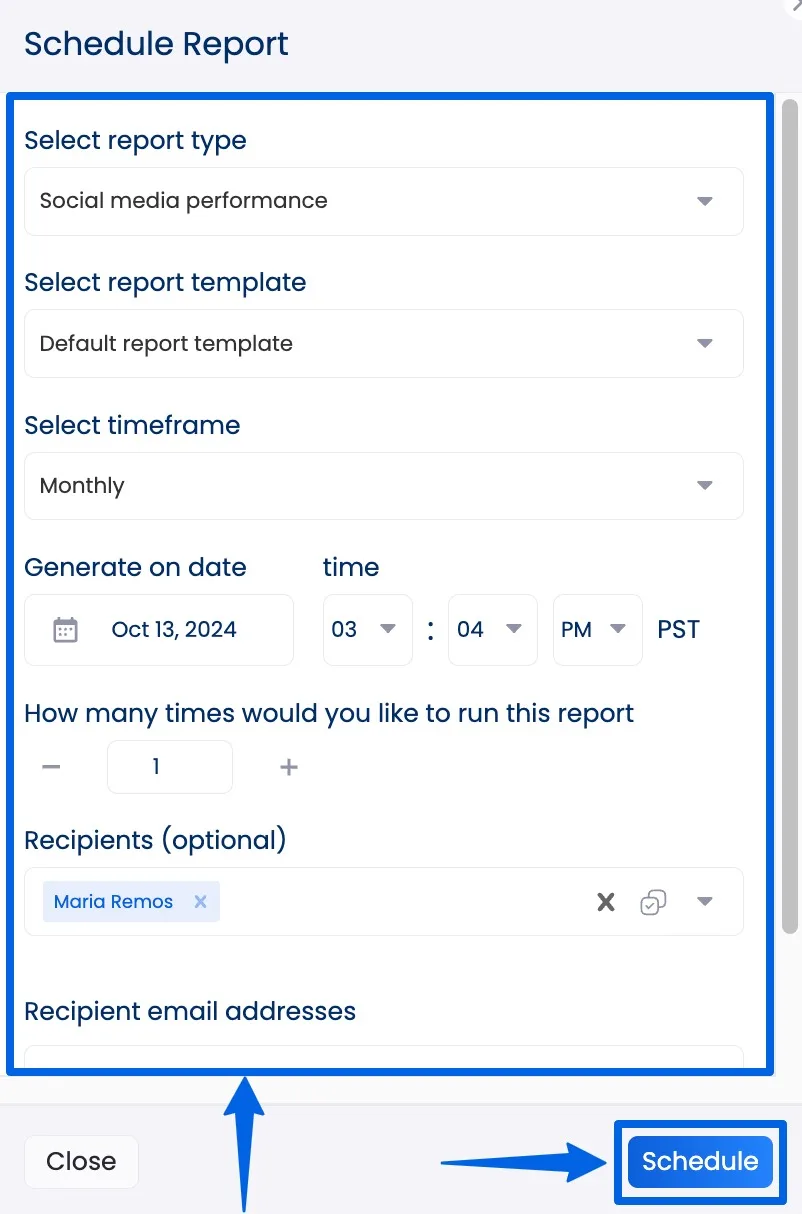
Vista Social’s Reports tool also includes an option to build custom reports tailored to your goals.
With the custom report template, you can:
- Choose specific metrics to drill down on the data that matters most
- Select your date range (daily, weekly, monthly—you’re in control)
- Automatically schedule reports to send to your team or clients (yes, you can schedule custom reports)
Click Reports on the main menu and select Report builder.
Select + Add template on the popup window and choose your report type.
Once you’re on the Report builder page, you can start customizing your report by:
- Specifying the social media channels you want to cross-analyze for benchmarking
- Adding a cover page and more text per section
- Renaming metrics
- Hiding sections you want excluded
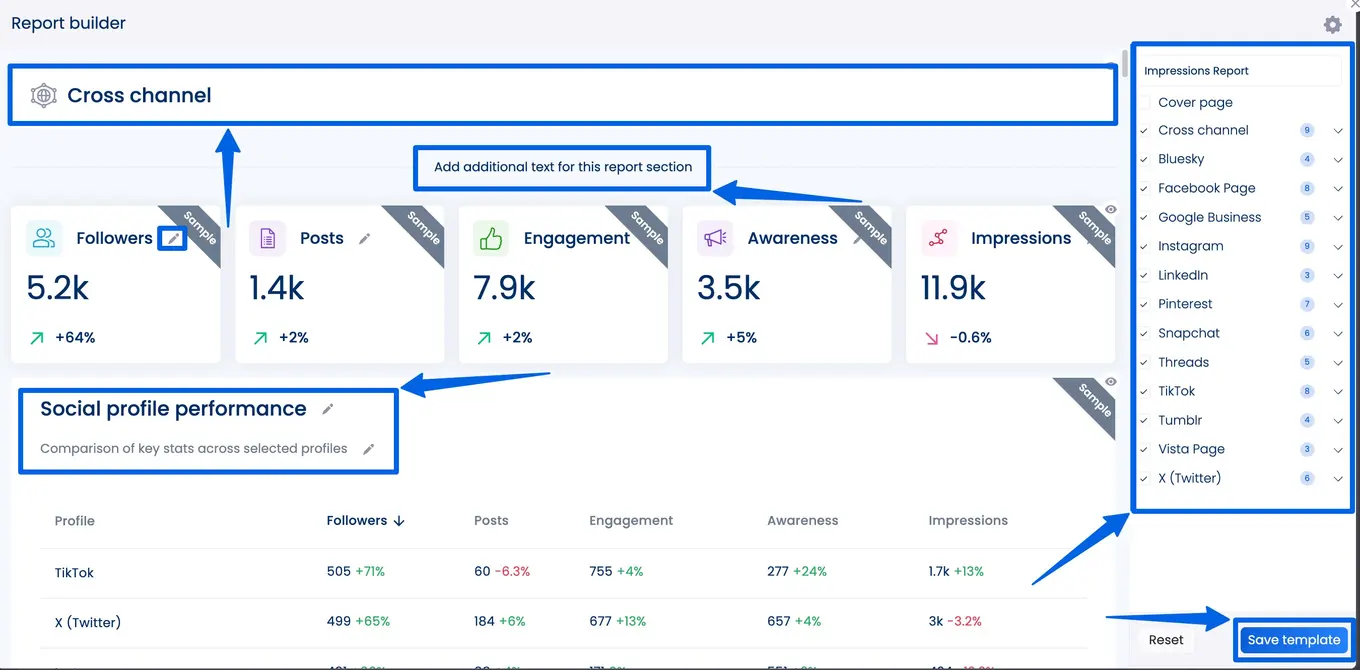
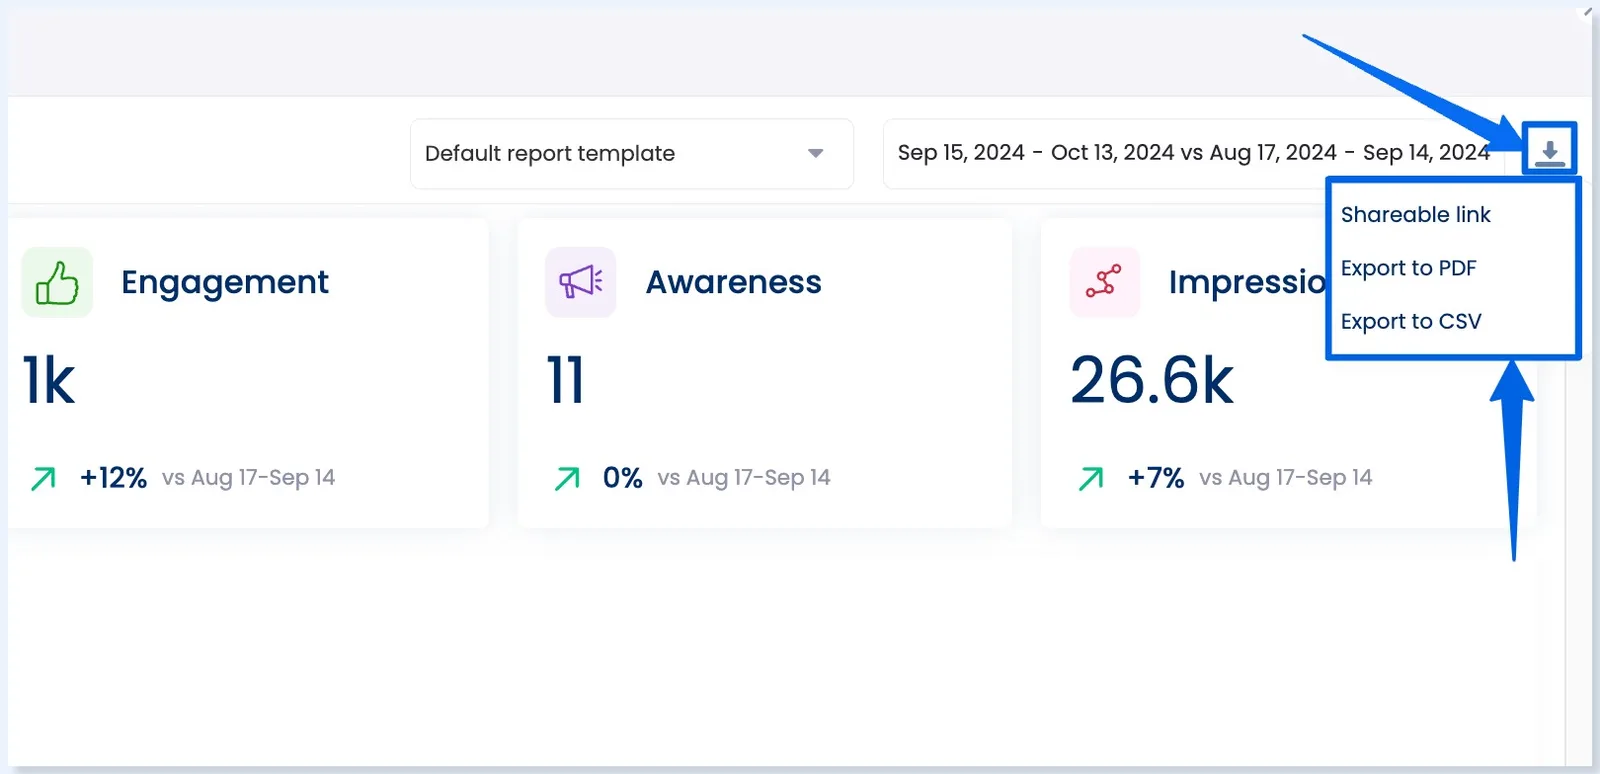
You can share your custom report (and other reports on Vista Social) via a direct link or export them as PDF or CSV files.
With Vista Social’s cross-channel reporting features, you’ll get analytics that work the way you work, not the other way around.
Instead of manually pulling data, formatting spreadsheets, and trying to remember which platform tracks what, you can use Vista Social to:
- Eliminate manual reporting tasks
- Create easy-to-read visuals for clients and stakeholders
- Set benchmarks to measure your clients’ social media growth over time
But wait! There’s more.
Vista Social doesn’t just offer analytics and reporting tools, but a comprehensive suite of sophisticated social media management features, such as:
- Content planning and scheduling, including bulk publishing and post queueing
- An AI Assistant that works with the platform’s Publisher, Social Inbox, and DM automations features
- Hashtag tools
- A collaborative content calendar with task management tools
- A unified Social Inbox
- Review management
- Optimal posting time suggestions
- Link in bio tool (Vista Page)
- Employee advocacy
- DM automations
- Post approval workflows
- Data integrations with other business tools, such as Slack
- Social listening with sentiment analysis
Must read: Social Listening Analytics: A Complete Guide
Key metrics to track for cross platform analytics benchmarking
To truly understand which platforms are driving results, below are the key metrics you should track to benchmark performance across your clients’ social channels.
Engagement Rate
Engagement rate gives you a standardized way to measure how actively your clients’ audiences interact with their content across various social media platforms.
Since follower counts and algorithms vary widely, tracking engagement rate helps you compare performance on a level playing field.
Reach
Reach tells you how many unique users saw your clients’ content.
It is key for benchmarking which platforms are best at expanding your clients’ brand visibility.
Monitoring and benchmarking the metric is especially crucial when you’re comparing organic reach on Facebook versus Instagram or LinkedIn.
Impressions
Impressions measure how often your clients’ content is displayed, even to the same person multiple times.
Cross-platform tracking of the metric helps you understand where your clients’ social media posts are most consistently showing up in feeds, which is great for identifying visibility trends.
Follower Growth Rate
A growing audience can signal healthy interest in your clients’ brands.
Comparing follower growth rates across social media channels shows you where your clients are gaining traction fastest—and where your content strategy may need a boost.
Click-Through Rate (CTR)
CTR helps you benchmark how well your clients’ content drives action across channels.
Are people more likely to click your clients’ links on Instagram or Twitter?
The metric tells you where your CTAs work.
Video Views and Watch Time
If you’re sharing video content across multiple platforms (such as TikTok, Instagram Reels, YouTube Shorts), comparing video views and watch time reveals where your videos are grabbing attention—and holding it.
Must read: YouTube Shorts Analytics Explained: An A–Z Breakdown
Conversion Rate
The conversion rate connects social performance to business results.
Comparing conversion rates across social platforms shows which channels are best at turning your clients’ viewers into subscribers, customers, or leads.
Post Frequency
Tracking how often you post on each platform helps you benchmark effort vs. return.
You may find that fewer posts on one channel outperform frequent posts on another, which is insight you can only get through cross-platform comparison.
Top-Performing Content
Identifying your clients’ highest-performing posts by platform helps you spot content trends.
What works on Facebook may flop on LinkedIn, and benchmarking lets you tailor your content per channel without guessing, so they’re likely to drive engagement.
Audience Demographics
Benchmarking audience demographics across platforms helps ensure your clients’ content reaches the right people in the right places.
It can also reveal opportunities to adjust your clients’ messaging or explore new platforms based on user behavior and audience fit.
What to consider before implementing cross platform analytics benchmarking
Consider the following to ensure that cross-platform analytics is useful to you and your clients (and not just another dashboard collecting dust).
Identify your goals upfront
Before you even think about comparing numbers, get crystal clear on why you’re benchmarking in the first place.
Are you trying to help clients boost engagement across all platforms?
Find out which channel drives the most traffic or conversions?
Or maybe figure out which social platform is worth the most time and budget?
Setting specific, measurable goals helps you filter out the noise and focus only on the data that actually matters to your team and clients.
Without clear goals, you risk collecting a bunch of data with no real purpose—aka analytics chaos.
Choose the right metrics to track
It’s easy to get overwhelmed with many cross-platform analytics benchmarking metrics (likes, impressions, saves, shares, clicks, comments, and so on) to keep an eye on.
The key is to select metrics that align with your clients’ and campaigns’ goals.
If you’re prioritizing engagement, focus on tracking and comparing metrics such as likes, comments, shares, and engagement rate.
If you’re all about traffic, monitor click-through rates (CTR) and conversions.
Remember that raw numbers don’t always tell the whole story.
Ratios and percentages (such as engagement rate or growth rate) are much more reliable when comparing across platforms with various audience sizes.
Use the right tools
Cross‑platform analytics sounds great, until you’re manually exporting CSVs from six different platforms and trying to line them up in Excel. 😩
Don’t do that to yourself.
Use modern tools such as Vista Social that pull in all your social data, standardize it, and display it in one clean, easy-to-understand dashboard.
Ensure your chosen tool supports features such as platform comparison, custom time ranges, automated reports, and industry benchmarks.
The right tool can save you a lot of time and energy, reduce errors, and keep you sane.
Pick a consistent timeframe
You can’t compare apples to apples if one platform’s data covers a week and another spans a month.
Choose a consistent time window (weekly, monthly, or quarterly), ideally whatever works best for your team.
Then stick to it for all your reports.
Doing so makes your comparisons more accurate and helps you spot patterns and trends over time.
And hey, trends are your best friend when it comes to social media strategy optimization.
Analyze, adjust, and repeat
Cross‑platform benchmarking isn’t a one-time project but an ongoing cycle.
Once you’ve gathered and compared your data, take action.
Double down on what’s working, tweak or pause what’s underperforming, and experiment with new ideas based on insights.
Then do it all over again next month (or next quarter).
The more consistent your benchmarking efforts, the clearer your social strategy becomes over time.
Share insights with your team and clients
Don’t let those beautiful benchmarks sit in a silo (where no one else can see or use them).
Turn your findings into clear, compelling visuals or reports that your team, leadership, or clients can actually understand.
Highlight wins (such as “Instagram engagement is up 24% since last month!”) and explain where there’s room for growth.
Must read: 12 Instagram Analytics Tools for 2025
The goal is to make your insights actionable, not just informational.
Additional tip: Use your social media analytics tool’s automated reporting feature to streamline data presentation and sharing. Trust me, it will save you from another late-night PowerPoint scramble.
FAQs on cross platform analytics benchmarking
How is benchmarking different from regular analytics?
Analytics focuses inward, examining your metrics such as post engagement or follower growth.
Benchmarking adds external context by comparing your metrics against competitors or industry standards, helping you understand if you’re leading, lagging, or on target.
How can benchmarks help improve your strategy?
Once you know how your performance stacks up, either with past periods or your industry, you can optimize social media platforms that are working, identify those that need attention, and refine your content approach accordingly.
After all, one of the best ways to improve is to compare what matters most.
What platforms can you compare and benchmark in cross-platform analytics?
You can compare most major social networks, such as Facebook, Instagram, LinkedIn, X (Twitter), TikTok, Pinterest, and YouTube, as long as your analytics platform supports them.
Must read: How to Use Pinterest Analytics to Drive Traffic and Sales
Some tools also let you include Google Analytics or website traffic for a more comprehensive view and broader comparison of your clients’ data.
Ready to level up your cross platform analytics benchmarking?
Cross‑platform analytics benchmarking isn’t just about tracking numbers, but it’s also about gaining clarity on what’s working, what’s not, and where to focus your time and resources.
By comparing performance across all your clients’ social channels, you can make smarter, data-driven decisions that move the needle.
Ready to simplify your analytics and see all your social metrics in one place?
Create your Vista Social account now to get an all-in-one platform for managing, measuring, and mastering social media like a boss.
Try Vista Social for free
A social media management platform that actually helps you grow with easy-to-use content planning, scheduling, engagement and analytics tools.
Get Started NowAbout the Author

Content Writer
Jimmy Rodela is a social media and content marketing consultant with over 9 years of experience, with work appearing on sites such as Business.com, Yahoo, SEMRush, and SearchEnginePeople. He specializes in social media, content marketing, SaaS, small business strategy, marketing automation, and content development.
Loading related tools...


Tools
PublishingAnalyticsEngagementIntegrations
FacebookInstagramLinkedInRedditSnapchatThreadsTikTokX (Twitter)YouTubeBlueskyVista Page (link-in-bio)All IntegrationsCopyright © 2026 Vista Social LLC. All Rights Reserved.