

Published on September 18, 2026
10 min to read
The YouTube Metrics Worth Putting in a Report

Summarize with AI

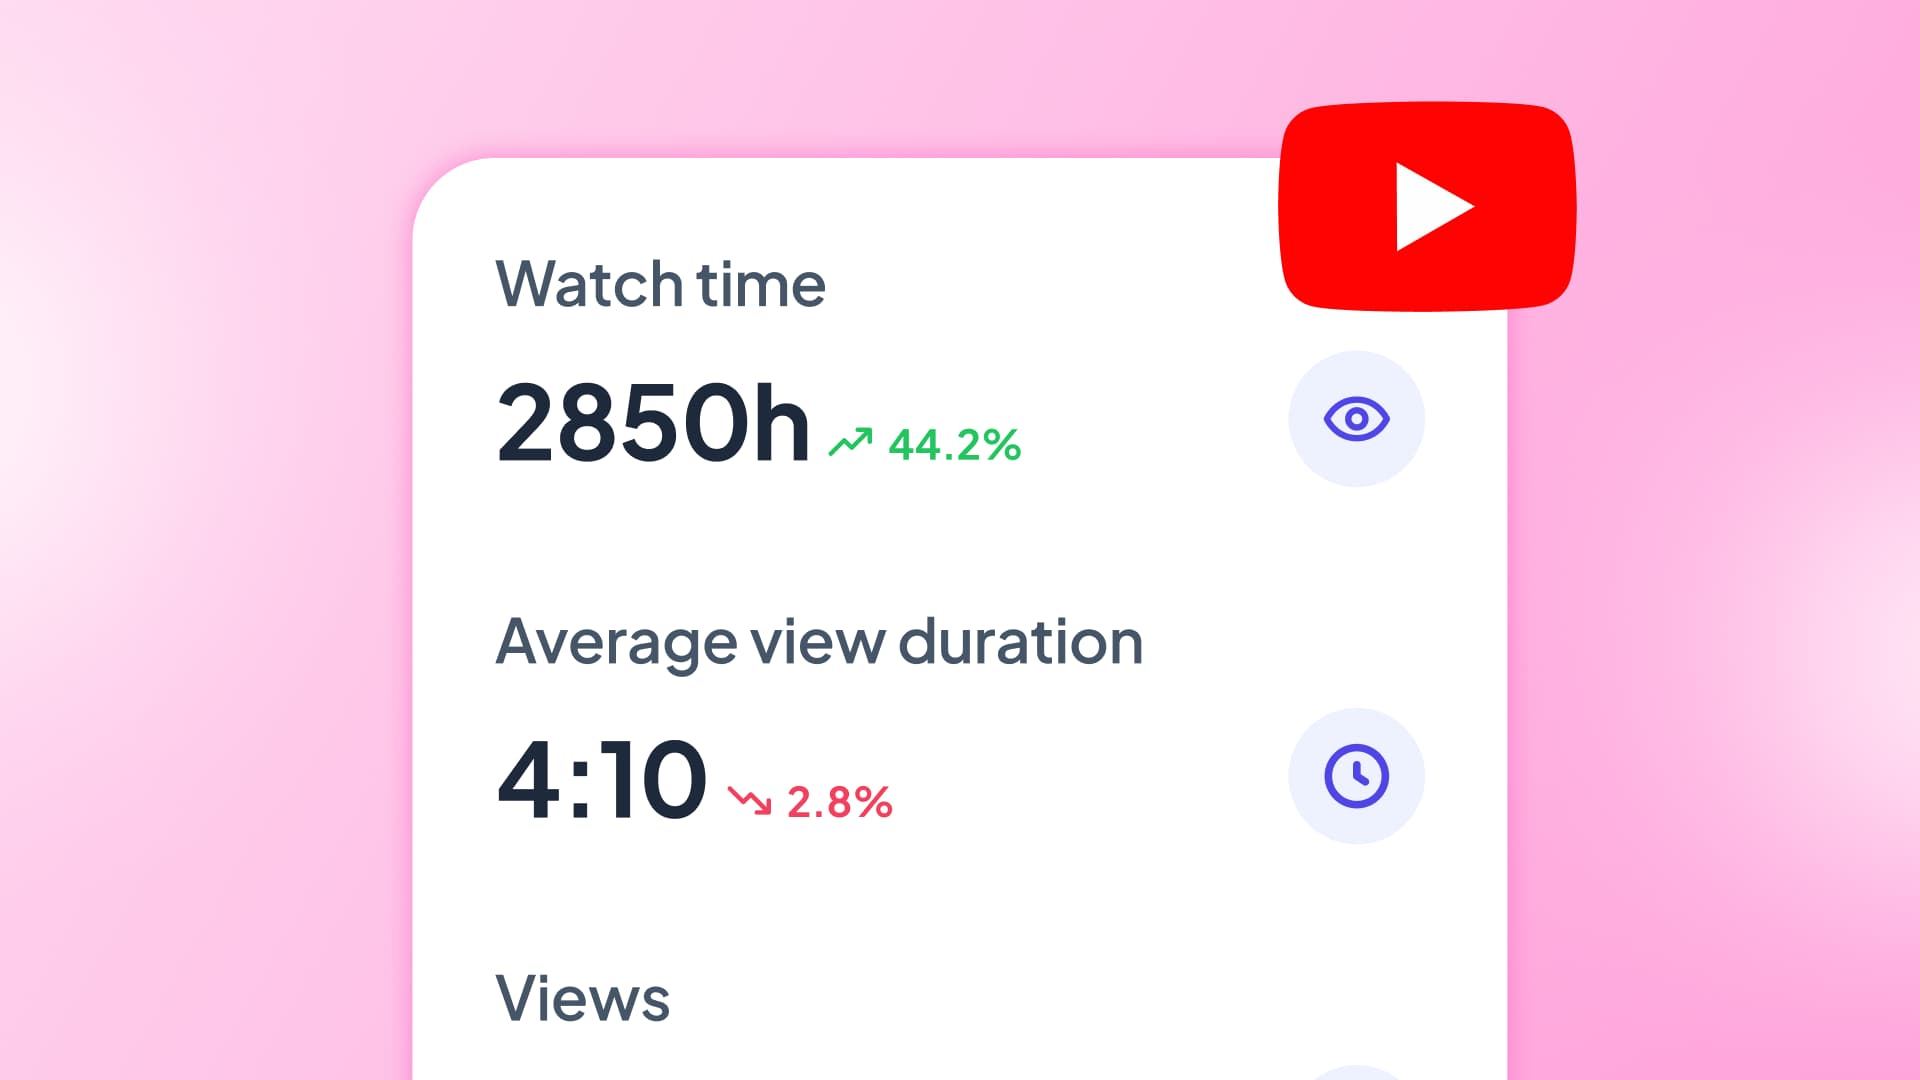
Table of contents
Summarize with AI

ChatGPT

Claude

Perplexity
Share

Vista Social

X (Twitter)


YouTube Studio gives marketers more numbers than any client report needs. The real work begins when you decide which ones deserve space on the slide.
A client may see that views rose 19% and still ask whether the right people watched, whether they stayed, and what the team should do next. A useful report answers all three because the reader should never have to decode a dashboard.
The clearest sequence starts with attention, then moves through packaging, audience growth, audience fit, and discovery. Views establish scale, while top videos guide the next creative decision.
A report makes an argument, and every number in it is either evidence or unnecessary.
This guide shows which YouTube metrics belong in a client or stakeholder report, how to read them together, and what each one should help your team decide.
YouTube remains central to video marketing: Wyzowl’s 2026 report found that 82% of businesses uploaded video to YouTube, while 69% of video marketers called it effective.
Table of contents
The short version
- Views need context: total and average viewing time show whether people stayed after clicking.
- Begin with the reader’s question: six numbers that answer real questions beat 30 that answer none.
- Show who watched: age, gender, country, and referrers often change the next content decision more than another reach total.
- Fix the report’s shape: a repeatable set can be scheduled, turning next month into a review instead of another rebuild.
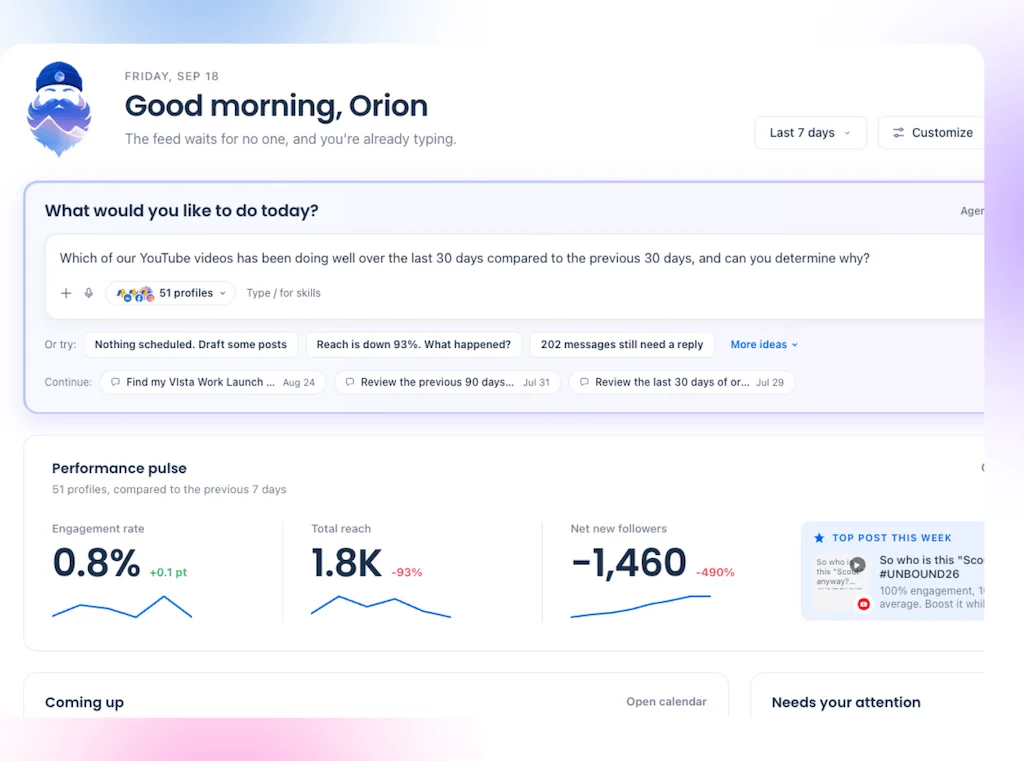
Want to bring YouTube into the same report as your other channels? See how Vista Social analytics keeps the evidence together.
Why YouTube reports become data dumps
The first report usually leads with views because everyone understands the word. Yet the total means little without publishing volume, a previous period, or a business question.
Three ways to frame the report
- Views only: Shows playback, but not hold, audience fit, or YouTube reach.
- Everything at once: Four slides of metrics make the reader choose what matters.
- The useful version: One headline answers the question, so a few numbers can prove it and one next step can close it.
This problem extends beyond one client call. The CMO Survey’s 2025 Highlights and Insights Report found that 64% of senior marketing leaders named demonstrating marketing’s impact on financial outcomes as a regular implementation challenge.
A monthly YouTube slide is the small version of that problem. The client needs to know whether the work succeeds, whom it reaches, and what should happen next.
The unfixed report takes longer because its shape changes every month. Settle the questions and evidence once, so the recurring work becomes interpretation rather than assembly.
Ask which question the report must answer, then make each YouTube metric earn its place.
Nissan case study: reach and attention tell different stories
Seven million views showed reach, while a 15-minute average watch time showed that people stayed.

Nissan introduced the all-electric Ariya with a four-hour animated lo-fi video and 15-track playlist. Paid placements helped distribute it, which is why the views do not represent purely organic reach.
The published YouTube case study reported three useful numbers:
| Campaign result | What it showed | Why it belonged in the report |
| More than 7 million views in the first month | The paid campaign achieved wide reach | It established the campaign’s scale |
| 15-minute average watch time across devices | Viewers stayed well beyond the initial click | It tested whether the four-hour format held attention |
| 19-minute watch time on connected TV | TV viewers stayed longer | It suggested a more settled viewing context |
What the slide could say
“The campaign passed seven million views, while average watch time reached 15 minutes overall and 19 minutes on connected TV. Reach showed the scale; viewing time showed that people stayed with the idea.”
Start with the question, then choose the metrics
Write down the question somebody asked, then choose the smallest set of numbers that answers it. Show the change and place the full export behind a link.
| Reader’s question | Put this in the report | What people often use instead |
| Is this working? | Watch time and average view duration | Views alone |
| Did the packaging work? | Impressions CTR beside average view duration | CTR alone |
| Is the audience growing? | Net subscriber change and engagement rate | Total subscribers and raw likes |
| Who watched? | Age, gender, and country | Subscriber count |
| Where did viewers come from? | Traffic sources and top referrers | Total views |
| What should we make next? | Top videos interpreted through the measures above | A ranking by views alone |
The exact set changes because a product film, webinar library, and entertainment channel serve different decisions. The reader’s question still chooses the metric.
1. Watch time and average view duration
Watch time shows the total attention earned, while average view duration shows how long the typical view lasted.
Read the pair against the previous period and comparable videos:
| What changed? | What it may mean | What belongs in the report |
| Watch time and average duration rose | More total attention and a stronger hold | Name the videos that drove both gains |
| Watch time rose but average duration fell | More output or reach, but a weaker hold per view | Separate publishing volume from the retention problem |
| Watch time fell but average duration rose | Fewer total views, but the audience that arrived stayed longer | Check sources before changing the content |
Keep views when the client asks for them, but do not leave them alone. A view records a legitimate playback, while watch time measures continued viewing.
Match like with like. A four-minute product demo and a 45-minute webinar should not share a view-duration target. Compare each video with the channel median and the best video in the same format.
Cross-industry benchmarks rarely help here. YouTube does not publish one “good” average view duration for every channel.
Broad benchmarks hide differences in format, audience, source, and video length. Your own channel provides the honest baseline.
2. Impressions click-through rate
Impressions click-through rate grades the packaging. Because it measures clicks after a thumbnail impression, it belongs beside the attention earned after the click.
| Click-through rate | View duration | Likely diagnosis | Next move |
| High | High | The packaging and video worked together | Repeat the topic and creative pattern |
| High | Low | The thumbnail wrote a cheque the video did not cash | Fix the opening or narrow the promise |
| Low | High | The viewers who clicked stayed, but too few clicked | Test the title, thumbnail, or placement |
| Low | Low | Neither the promise nor the viewing experience held | Revisit the angle before polishing the packaging |
YouTube itself connects impressions, CTR, views, and watch time in a viewer path. The report should preserve that relationship instead of isolating the most flattering number.
What the slide could say
“The packaging earned clicks, but early viewing tells us the opening needs work.”
3. Subscriber growth and engagement
The total subscriber count describes the channel’s history. Net subscriber change describes what happened during the chosen period.
YouTube’s own guidance warns that subscribers are not the same as active viewers. People can subscribe and stop returning. As a result, a large lifetime total can sit beside a much smaller monthly audience.
Put three lines on the slide:
- Net subscriber change: Did the channel gain or lose subscribers during the period?
- Monthly or unique viewers: Compare the active audience with subscribers because the lifetime total can hide churn.
- Engagement rate: Shows response after accounting for channel size.
A channel attracting viewers without building a returning base may need a clearer content promise or stronger series. Engagement rate also keeps a small channel from looking weak merely because its raw likes are lower.
This is the distinction behind our guide to vanity metrics: a large number becomes useful when it helps answer a decision, not when it merely makes the slide feel busy.
4. Audience demographics
Audience data answers a common client question: “Are these the people we meant to reach?”
Read the three charts against the plan, not in isolation:
- Age: Does the leading group resemble the intended buyer or viewer?
- Gender: Does the mix support the audience assumed in the creative brief?
- Country: Are viewers concentrated in markets where the brand can sell or operate?
For example, a US-focused channel drawing half its views from an unavailable market may have a reach or language mismatch.
That diagnostic is an example rather than a customer result. The next test could localize examples and thumbnail language, then compare the audience again.
YouTube places limits on this data. Its current audience guide says age, gender, and location data may be limited. Missing rows do not equal missing people.
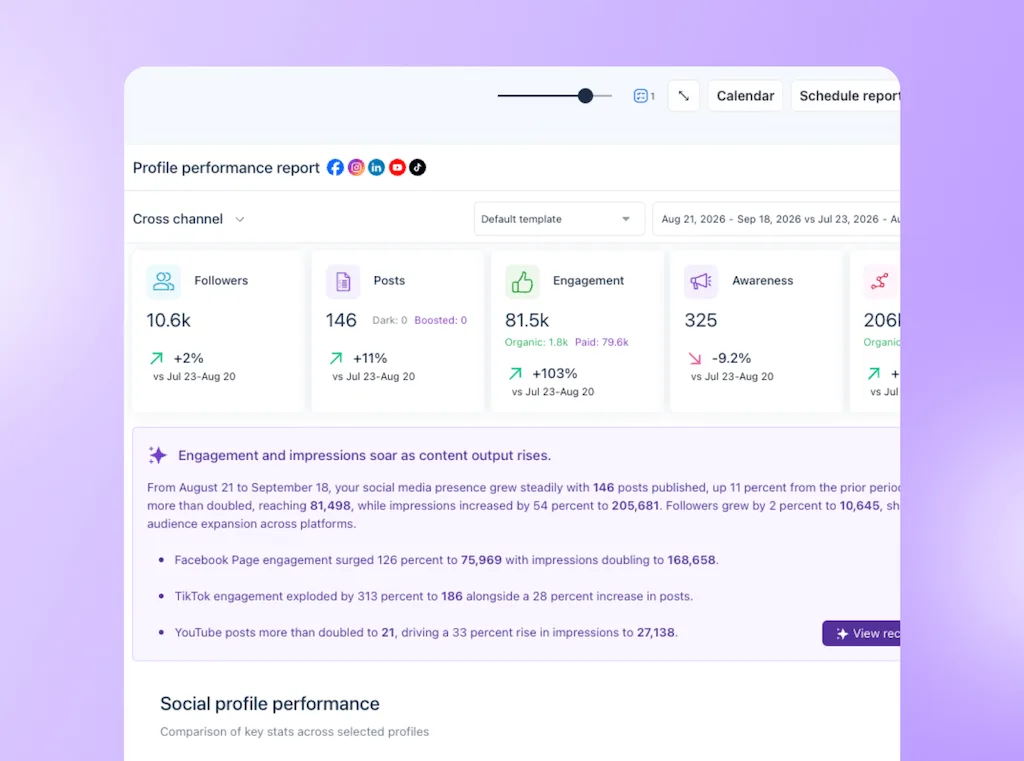
Vista Social can place YouTube audience data inside the wider social report. Its current YouTube definitions include viewers by age and gender plus views by country.
Add a coverage note beneath the charts:
- Age and gender: Although useful, this covers signed-in viewers over the last 30 days.
- Country: Uses a rolling 30-day window while including only the views YouTube could place.
- Missing rows: May reflect privacy limits or a sample too small for YouTube to show.
That limitation belongs on the slide because a precise-looking chart can still represent only part of the audience. For an example of the combined reporting view, see the full report.
5. Traffic sources and referrers
Traffic sources show whether YouTube distributed the video or your team supplied the audience, and those situations require different next steps.
- YouTube Search: People found the video through a query. Review the search terms and build on the problem they reveal.
- Browse features: Home, subscriptions, Watch Later, and other browsing surfaces supplied traffic. Packaging and returning interest are doing more work.
- Suggested videos: Other videos led viewers into yours. Check which videos and topics create that path.
- External sources: Websites, newsletters, communities, or embedded players sent the audience. The promotion worked, although YouTube may not yet be distributing the video widely itself.
- YouTube advertising: Paid placement contributed views. Keep that traffic separate when interpreting organic discovery.
Top referrers make reach concrete because a view total cannot separate Search, a client email, an embedded article, and paid media.
What the slide could say
“Search became the top source after the tutorial series launched, so we will expand the two queries already earning useful watch time.”
How to structure a useful YouTube report
Use one headline, six evidence groups, a prior period, top videos, and one next step.
Use this order:
- Headline: Write the decision or diagnosis in a sentence.
- Attention: Show total and average viewing time against the last comparable period.
- Packaging: Put impressions CTR beside duration so the click and the viewing experience stay connected.
- Audience movement: Report net subscriber change and an engagement rate rather than lifetime totals alone.
- Audience fit: Show the available age, gender, and country data with its coverage note.
- Sources: Name the leading traffic sources and referrers.
- Creative direction: Use the top videos to explain what to repeat, change, or stop.
Keep views as context when the client expects them, and place the export in an appendix. A shorter report with a clear argument reads as more senior work.
YouTube Studio offers the deepest view of one channel, especially retention curves and early video results. Vista Social handles the assembly problem by placing YouTube beside the other networks a client expects.
Current Vista Social reports include net subscriber growth, engagement, views, audience data, country, referrers, and top posts. Custom reports join chosen sections, while scheduled delivery sends them to named recipients.
The product boundaries matter because custom report building and branded PDFs begin on Advanced, while scheduling starts on Professional. Vista Social can organize only the data YouTube provides.
Our guides to automated reports and client reporting cover the delivery process once the metric set is settled.
When YouTube Studio is enough
A strong YouTube report should leave the reader knowing what happened, why it happened, and what the team will do next. Use the final slide to answer those three questions directly because the decision should be easier to find than the data:
- What changed?: State the most important result in one sentence and compare it with the previous period or a similar video.
- Why did it change?: Name the video, audience segment, or traffic source that best explains the movement.
- What happens next?: Commit to one creative, distribution, or reporting action before the next review.
Views can establish scale, and top videos can supply creative direction, but the report earns its place when those numbers lead to a decision. The fixed structure lets the team spend more time interpreting the audience and less time rebuilding slides.
The YouTube metrics that matter most
A strong YouTube report should leave the reader knowing what happened, why it happened, and what the team will do next. Keep the evidence in this order:
- Attention: Watch time and average view duration show whether viewers stayed.
- Packaging: Impressions click-through rate reveals whether the title and thumbnail earned the click.
- Audience movement: Net subscriber change, active viewers, and engagement rate show whether the channel is building a responsive audience.
- Audience fit: Age, gender, and country indicate whether the content reached people the brand can serve.
- Discovery: Traffic sources and top referrers explain how viewers found the content.
Views still belong in the report as context, while top videos turn the evidence into a creative decision. Compare each result with the previous period and similar videos from the same channel. That gives the reader a credible baseline and gives the team a practical next move.
The fixed structure makes reporting faster because the team can spend more time explaining what the audience chose, where attention held, and what deserves another investment.
Turn your YouTube data into a report people can act on.
Bring YouTube into a scheduled, branded report alongside the channels your agency, brand, or leadership team already reviews.
Frequently asked questions
What are the most important YouTube metrics to track?
For a client report, start with watch time, average view duration, impressions, click-through rate, net subscriber change, audience data, and traffic sources. Add views as context and use the top videos to choose a next step.
What is a good average view duration on YouTube?
There is no credible universal benchmark across industries and formats. Compare a video with your channel median and with the best-performing video of a similar length and purpose. A webinar, product film, tutorial, and Short should not share one target.
Should I report YouTube views or watch time?
Report both, but give them different jobs. Views show reach, while watch time shows the attention that reach produced. Pair them with view duration so publishing more does not always look like better work.
How often should I send a YouTube report?
Monthly suits most clients and senior leaders because channel results grow more slowly than a weekly report suggests. Keep a weekly team check for new-video CTR and early retention while there is still time to adjust packaging or reach.
Can I see YouTube analytics without opening YouTube Studio?
Yes. A social media management platform can bring selected YouTube growth, engagement, audience, country, referrer, and post metrics into a wider report. YouTube Studio still provides the deepest video-level analysis, so use it when investigating retention or detailed reach.
Which YouTube metrics should I leave out of a client report?
Remove any number that cannot answer a client question or change the next step. Raw likes, lifetime subscribers, impressions alone, and revenue fields for an unmonetized channel usually belong in the export. Keep the appendix available without making the reader decode it during the meeting.
Try Vista Social for free
A social media management platform that actually helps you grow with easy-to-use content planning, scheduling, engagement and analytics tools.
Get Started NowAbout the Author

Content Writer
Orion loves to write content that refuses to be boring. As part of Vista Social, he helps brands, creators, and agencies stop doom scrolling and start winning with social media. When he's not in front of a keyboard, he's watching films in IMAX with his wife, dissecting football tactics (the European kind), and getting lost in a good book.
Loading related tools...

The most complete social media management platform for teams who demand more.






Tools
PublishingAnalyticsEngagementIntegrations
FacebookInstagramLinkedInRedditSnapchatThreadsTikTokX (Twitter)YouTubeMCPVista Page (link-in-bio)All IntegrationsCopyright © 2026 Vista Social LLC. All Rights Reserved.