


Published on August 17, 2025
12 min to read
Analytics for Multi-Location Brands: Comparing Regional Social Performance

Summarize with AI


Table of contents
Summarize with AI

ChatGPT

Claude

Perplexity
Share

Vista Social

X (Twitter)


Managing analytics for multi-location brands?
Yeah… it can feel like trying to herd caffeinated cats.
You’ve got different regions, audiences, and platforms all demanding attention at the same time.
Maybe one store’s Instagram is blowing up, while another location’s Facebook page is so quiet you could hear a pin drop.
Sound familiar?
Here’s the thing—you don’t have to drown in all that data.
With the right analytics, you can cut through the clutter, see what’s actually working, and make sense of it all without the headache.
That’s what we’re diving into here.
I’ll walk you through how to compare regional performance, spot the wins (and the misses), and turn those insights into strategies that actually move the needle for your clients’ brands.
Ready? Let’s go.
Table of contents
What you will learn
- What is analytics for multi location brands?
- Analytics for multi location brands vs social media analysis: What’s the difference?
- Why analytics for multi-location brands is crucial for your social strategy
- Analytics for multi‑location brands: Steps and tips to compare social performance across regions
- How to streamline analytics for multi-location brands with Vista Social
- What to watch out for with analytics for multi location brands
- FAQs on analytics for multi location brands
- Mastering growth through analytics for multi location brands
What is analytics for multi location brands?
Analytics for multi-location brands is the art of keeping tabs on how each brand’s business locations are doing, without losing your mind in a sea of spreadsheets.
Think of it like running multiple mini social media universes under one big brand umbrella.
You’re checking which store’s Instagram is blowing up, which city’s Facebook posts are crickets, and where your clients’ audiences are showing the most love (or, you know… not so much).
Must read: 12 Instagram Analytics Tools for 2025
Multi-location brand analytics is about:
- Tracking each location’s social media or campaign performance
- Comparing results to see who’s killing it and who needs a boost
- Spotting local trends, such as that pumpkin latte everyone in Portland can’t stop posting about
- Sharing what works so all your clients’ locations achieve social media success
Essentially, multi-location business analytics is your game plan for turning scattered stats into insights that help you develop and improve strategies to make every location shine.
How to streamline analytics for multi-location brands with Vista Social
Running social media for a multi-location brand can involve A LOT of data wrangling.
Plus, tracking performance across various accounts, regions, and teams can quickly turn into a spreadsheet nightmare.
The good news is that Vista Social provides a better way to manage it all without the chaos.
The social media platform’s analytics features simplify how you collect, analyze, and act on data, no matter how many locations you’re managing.
Forget jumping between platforms and profiles.
Vista Social lets you connect multiple social profiles across brands, locations, or clients into a single, unified dashboard.
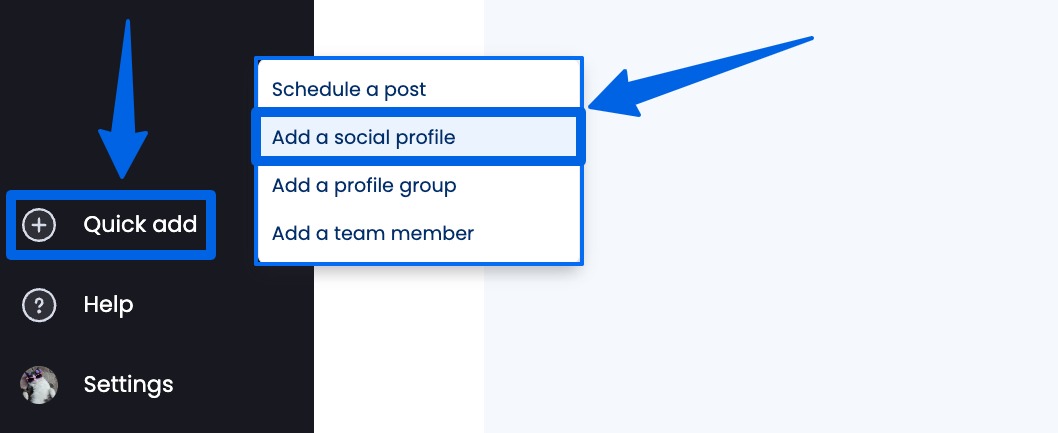
Select the Quick add option on the left-hand menu and click Add a social profile.
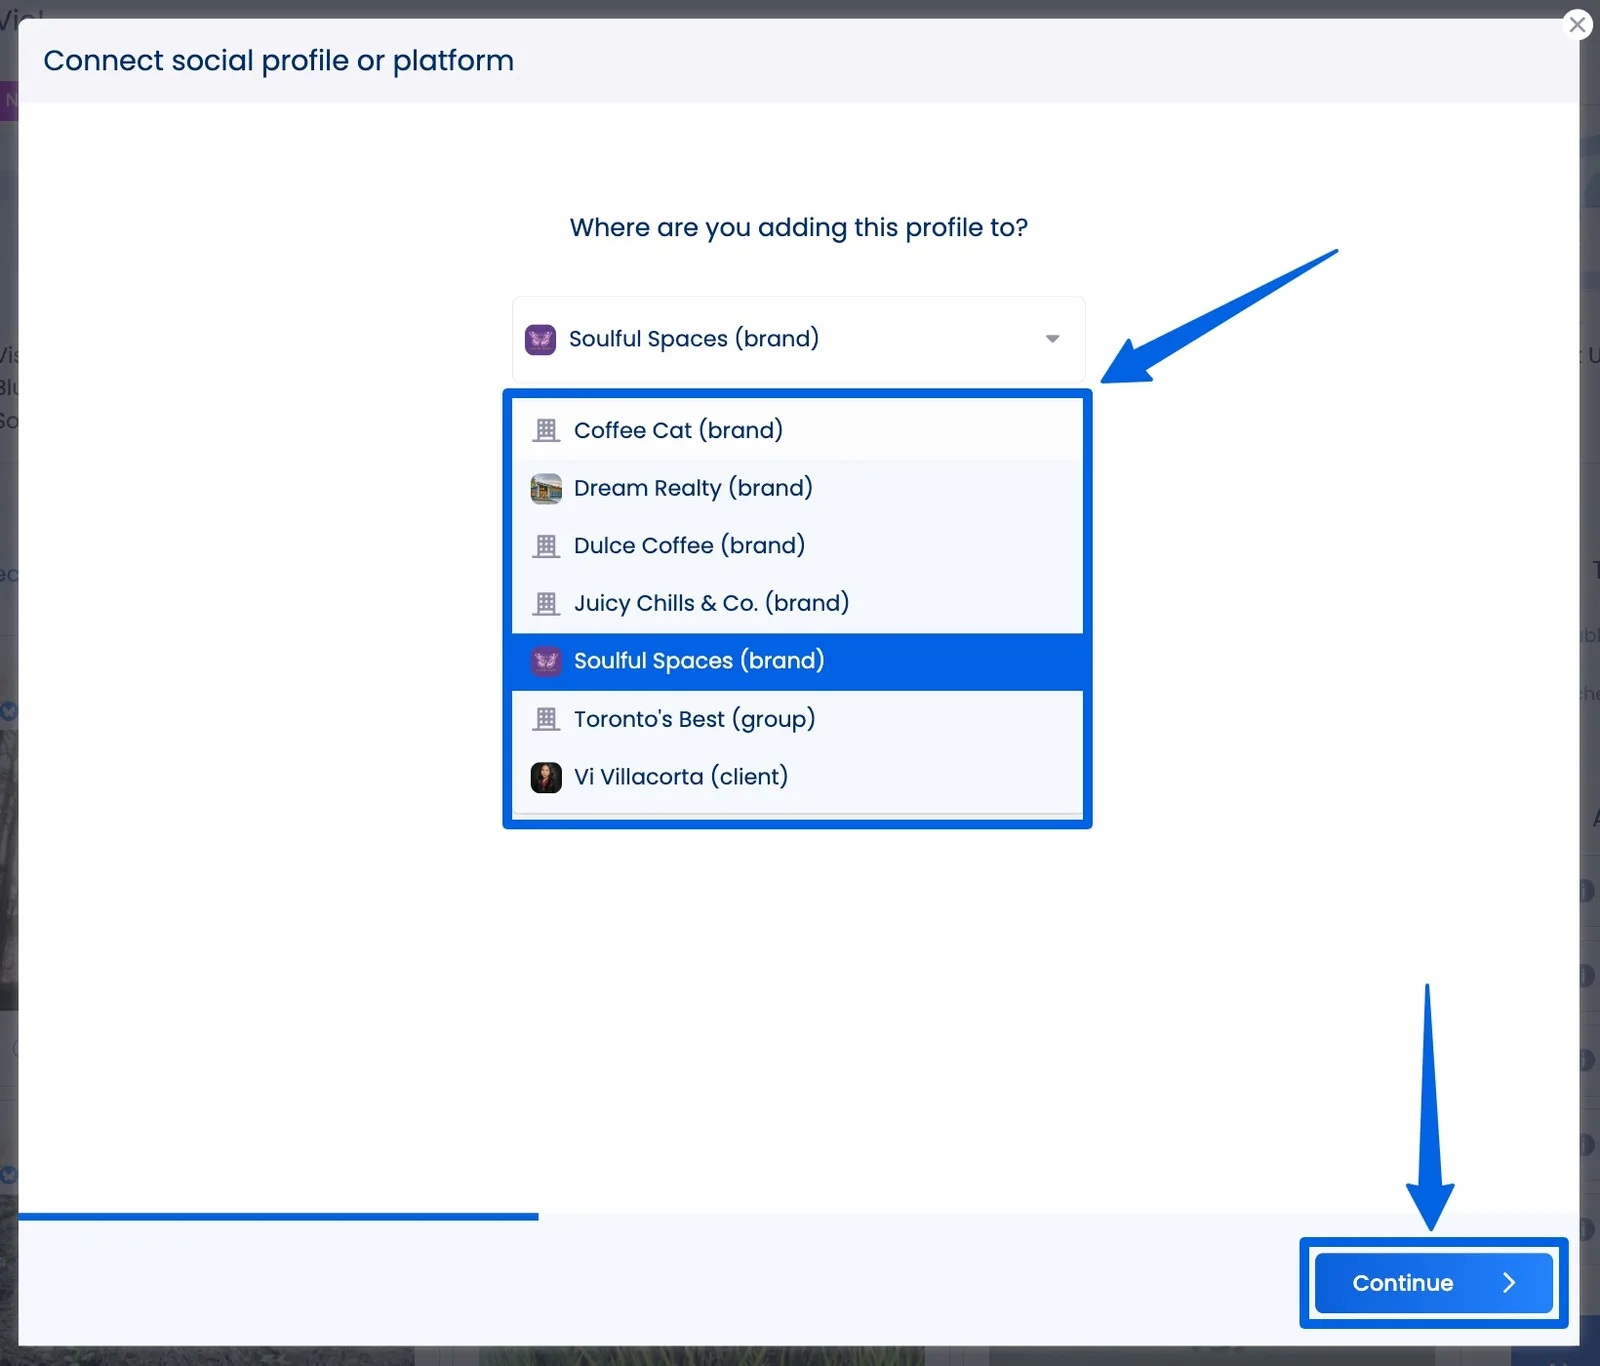
Select which profile group to connect the profile to. You can create profile groups for brands or specific locations.
Select the social network you want to connect from (such as your client’s Facebook page or Instagram creator account).
Must read: 10 Facebook Analytics Tools Used by Top Marketing Agencies
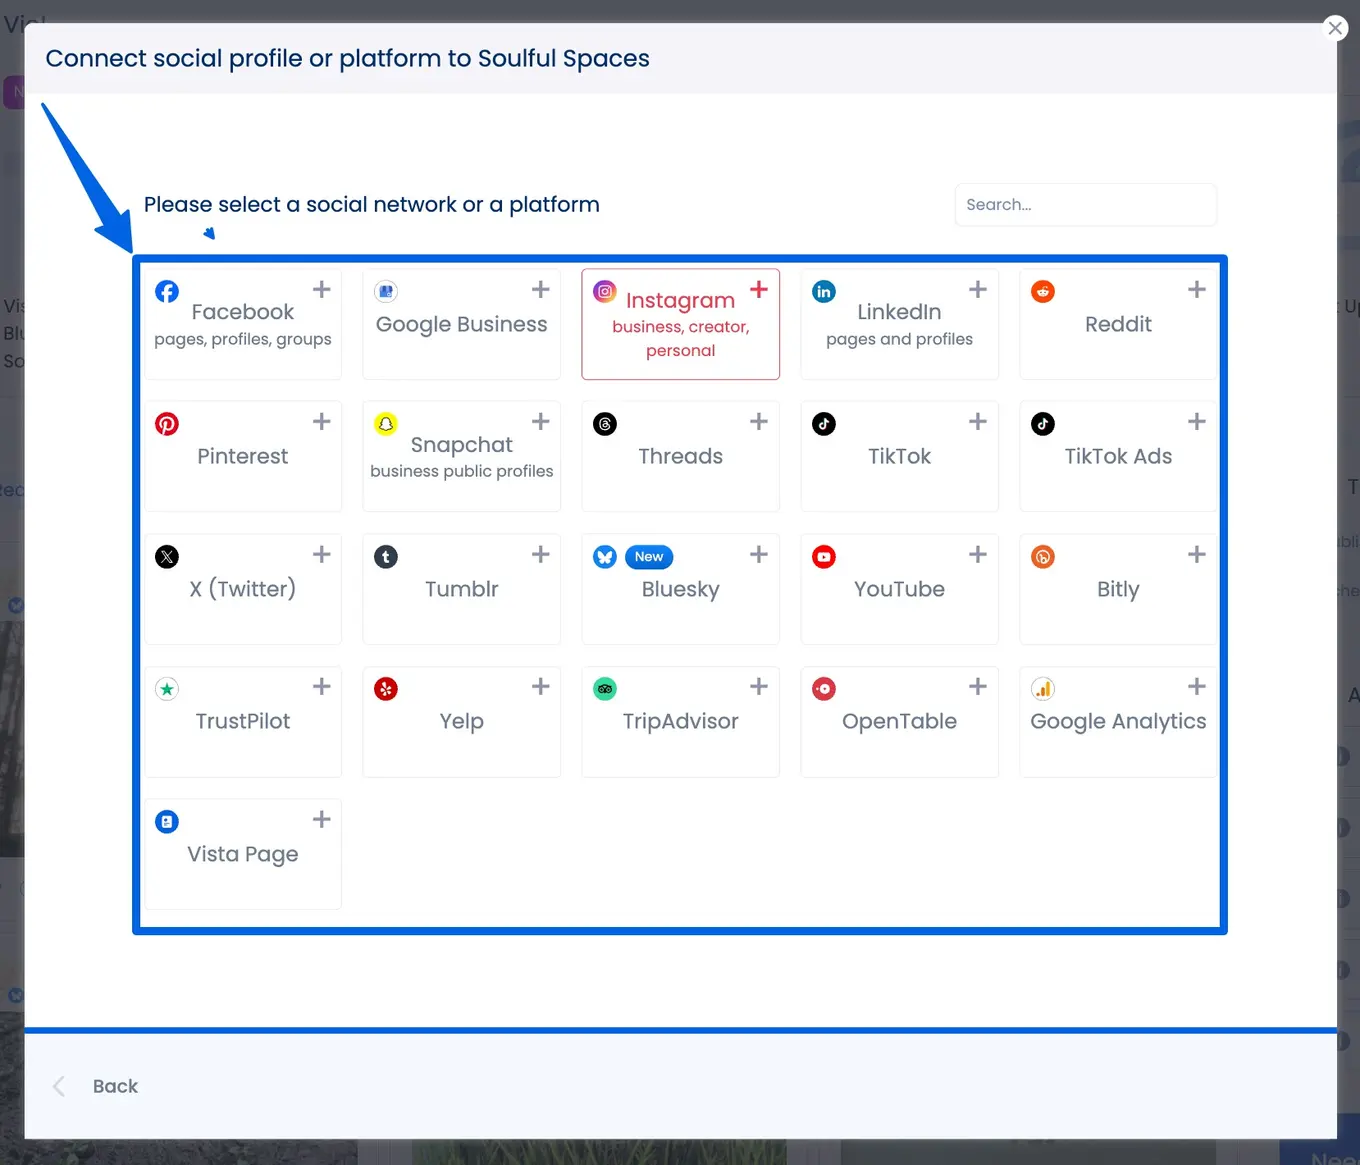
The following steps can vary depending on the social channel.
Some social media platforms, such as Pinterest business accounts and X (Twitter) profiles, only need you to authorize Vista Social to access the accounts.
Must read: How to Use Pinterest Analytics to Drive Traffic and Sales
However, other channels may require additional steps to complete the setup.
Once all your clients’ profiles are connected, Vista Social’s social media analytics feature can start pulling data for analysis.
Important note: It takes two to three hours for Vista Social to complete the first data analysis, so if you have just connected the profiles, it’s best to wait a couple of hours before running your first report.
Creating reports for each location doesn’t have to mean repeating the same process a dozen times.
Vista Social’s reporting tools let you generate detailed analytics for individual locations or roll them all into a top-level brand overview. That means more time strategizing and less time formatting.
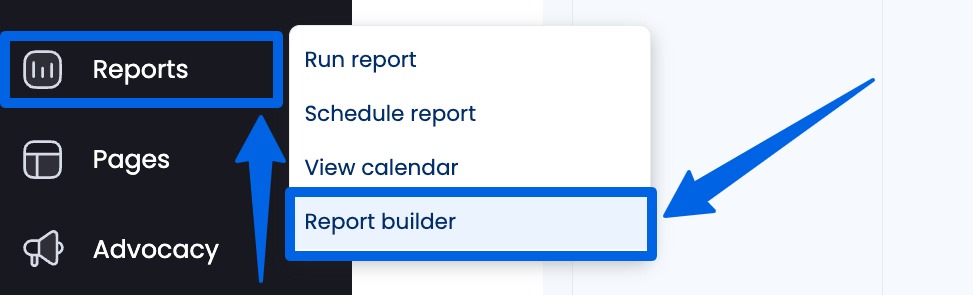
To generate your report, click Reports on the left-hand side menu and select Run report.
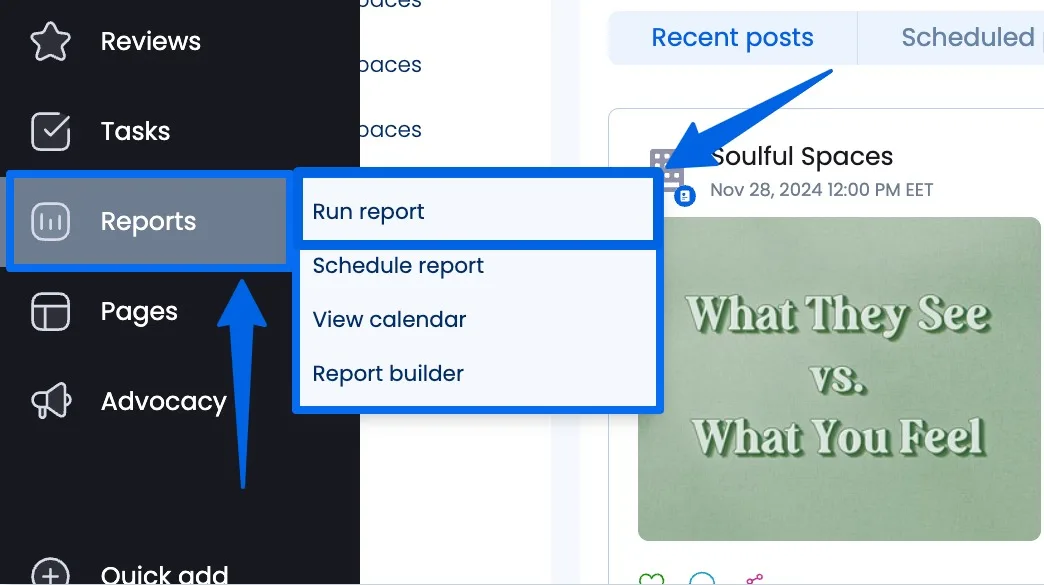
You can also select the Run report option from the content calendar.
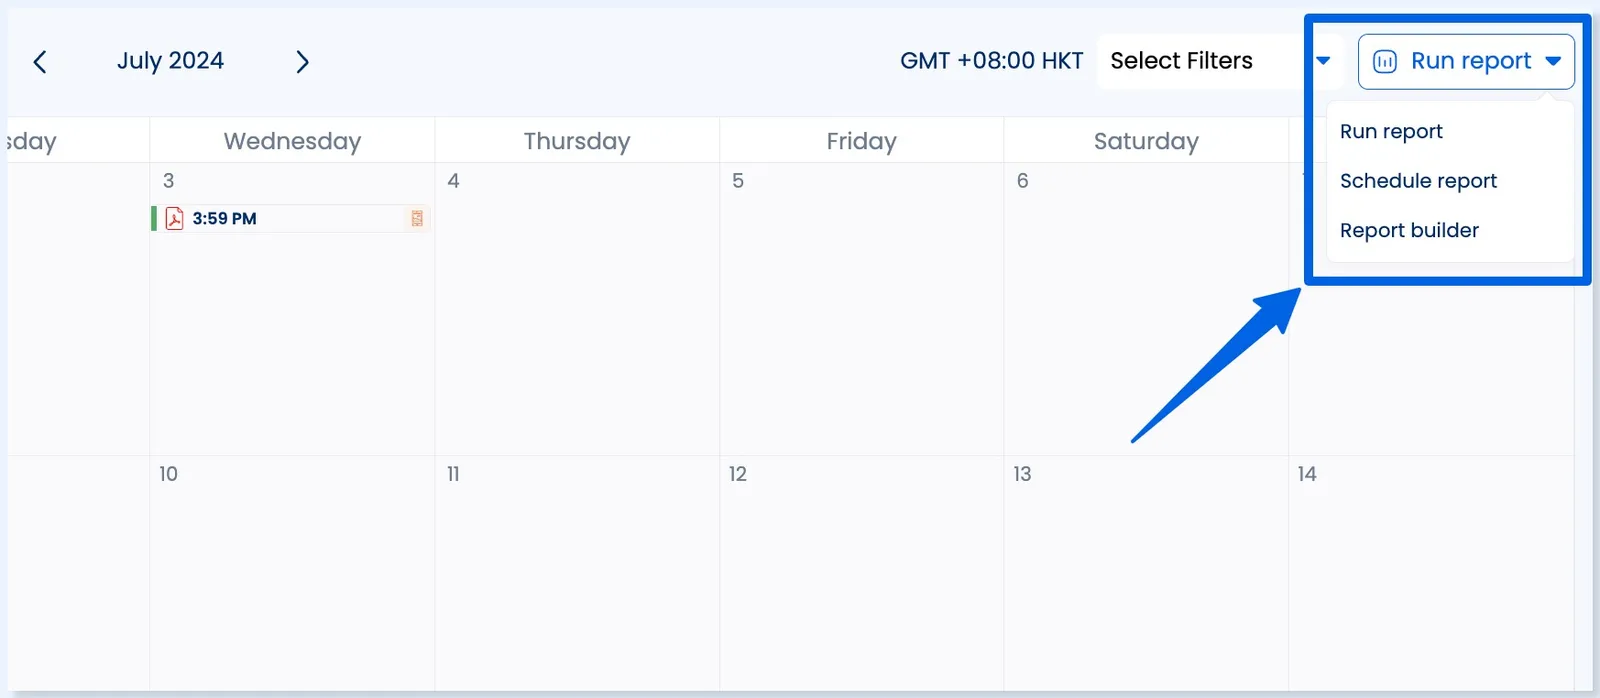
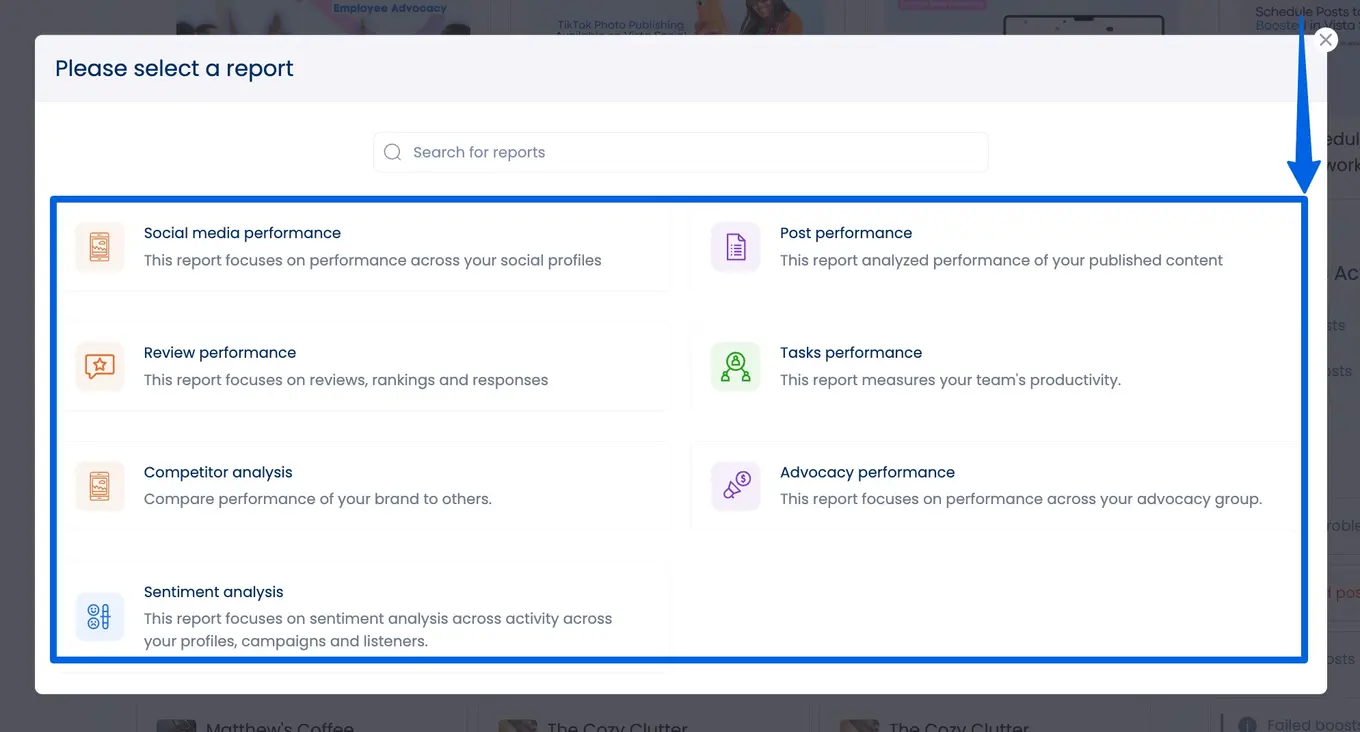
Choose your report type.
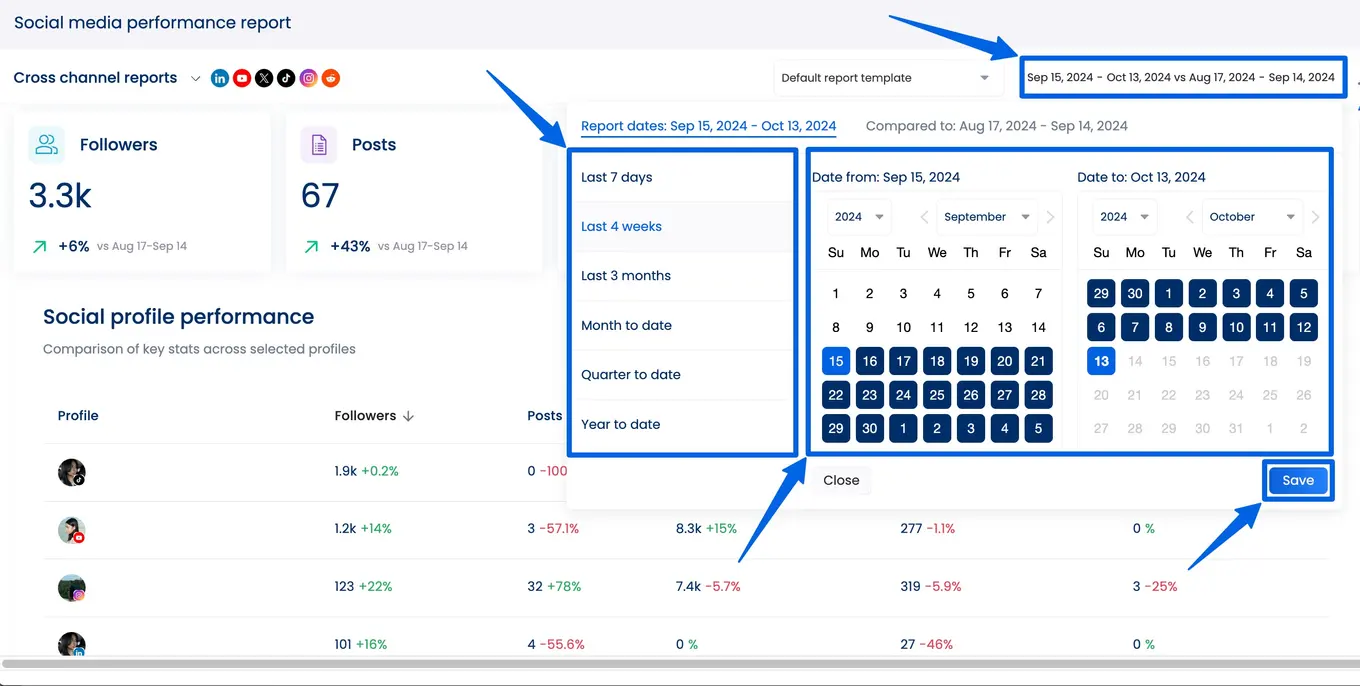
If you want to run the report immediately, select the specific date range and comparison period.
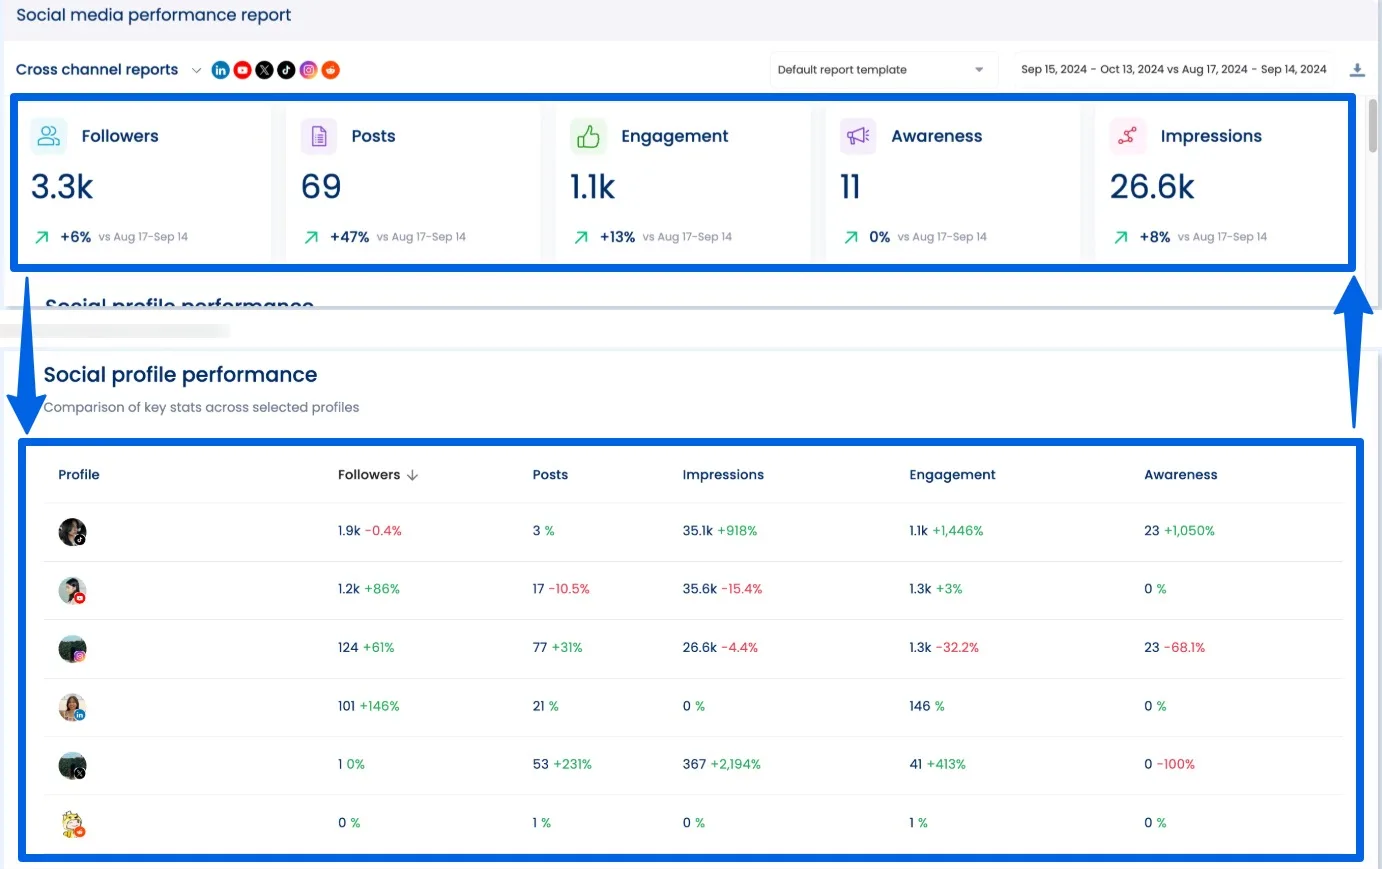
Vista Social offers several reports that track key metrics to give you valuable insights into each location’s social media performance.
For example, the Social Media Performance report includes cross-channel metrics that help you track the performance of your clients’ specific location across multiple social media platforms (YouTube, Instagram, Facebook, TikTok, and more).
Must read: 15 TikTok Analytics Tools Worth Trying this 2025
You can share your reports with your team and clients by exporting and downloading them as PDF or CSV files, or you can generate a direct link for quick and easy sharing.
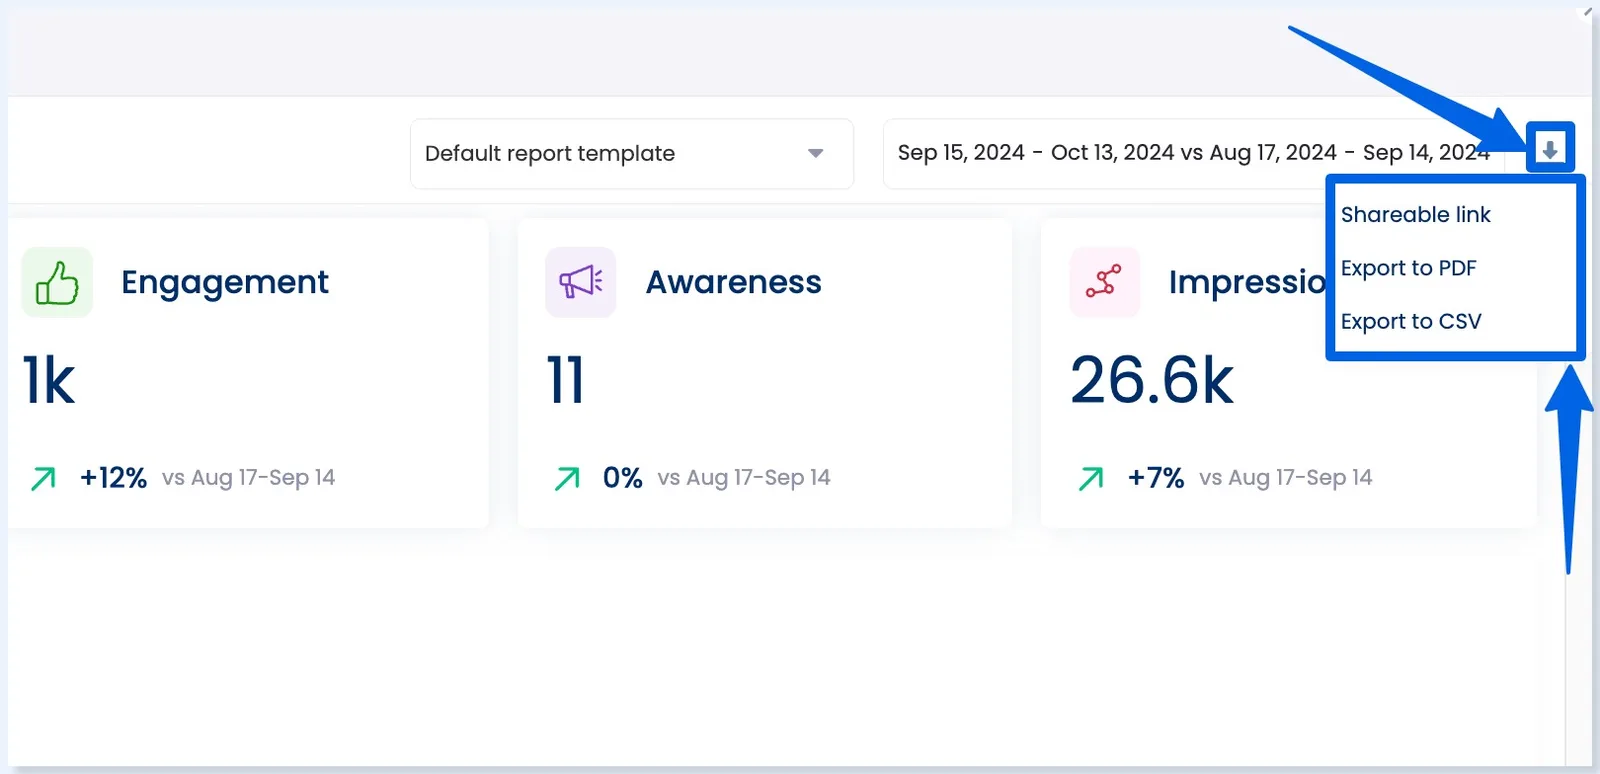
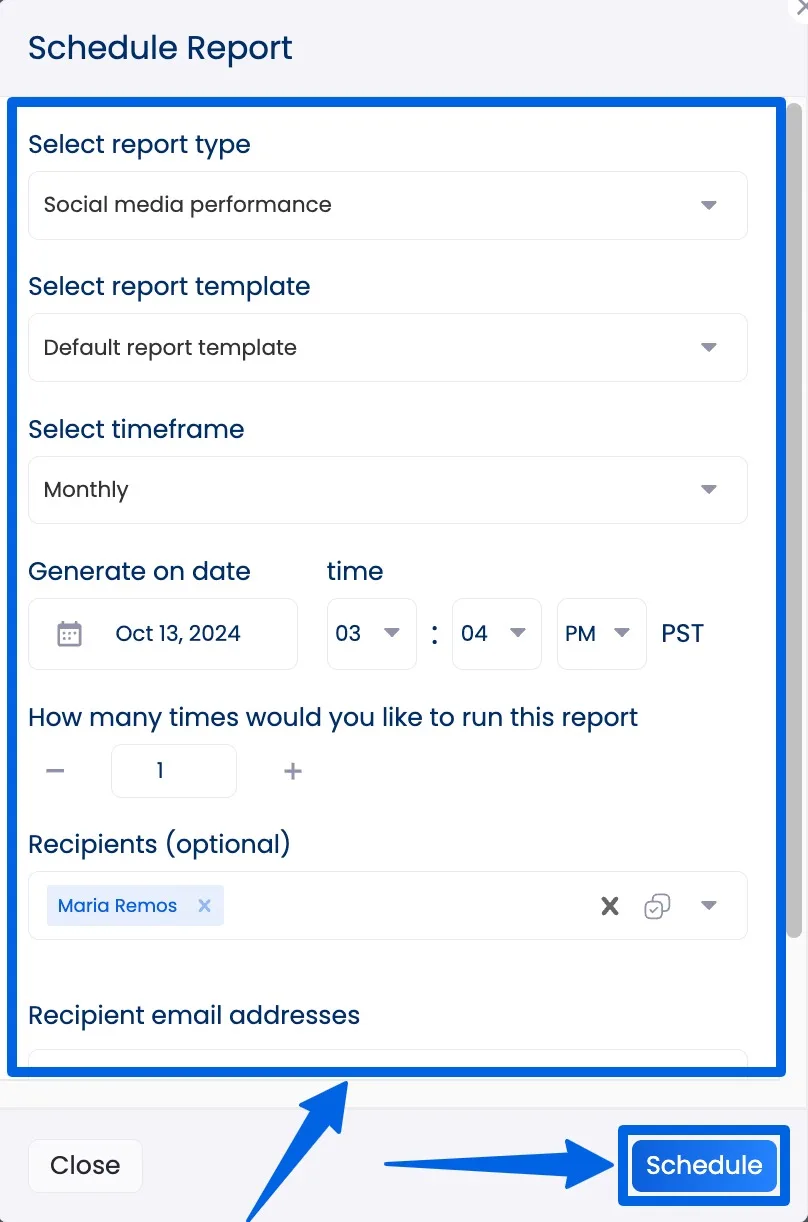
Vista Social makes generating and sharing analytics data even easier by letting you schedule your reports.
There’s more!
Vista Social offers report templates that you can easily customize to include the metrics and insights you need in your analytics reports.
Go to the Report builder.
Click + Add template and choose your report type.
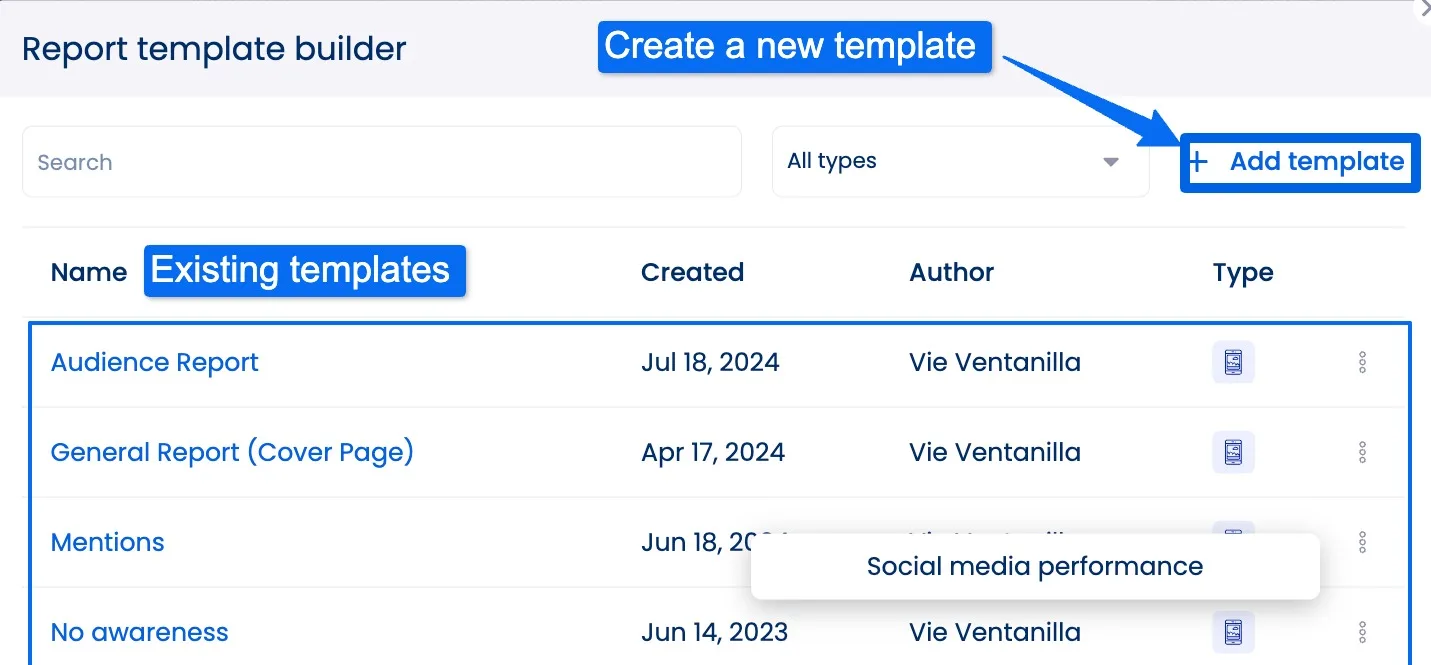
Customize your template accordingly.
You can specify the social channel data (Snapchat, Bluesky, Instagram, etc.) you want to include, add texts, sections, and a cover page, edit headings and titles, change the metrics, etc.
Must read: Snapchat Analytics Ultimate Guide: What to Track, FAQs, Etc.
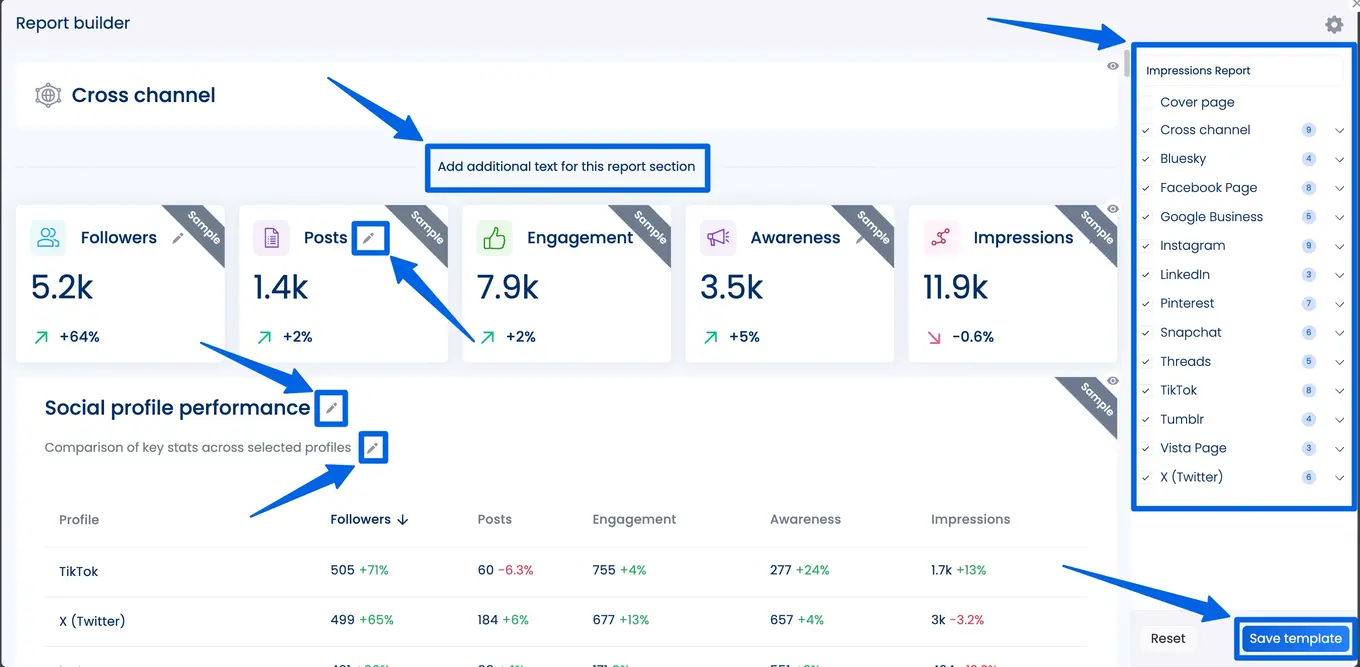
When you’re done, save your template and run, schedule, and share it.
Vista Social’s reports also include predictive analytics insights that help you spot hashtags, topics, and other emerging trends before they become obvious.
Must read: Hashtag Analytics Guide: With Tips, Tools, and Strategies
This way, you can make proactive decisions, not just reactive ones.
The feature includes:
- The best time to post suggestions per location, based on audience engagement trends
- Content performance forecasts to help guide what to post more (or less) of
- Audience growth trends to identify which regions are gaining traction
Vista Social’s other social media management features include:
- Content planning, publishing, and scheduling
- A content calendar
- Review management
- Engagement management with a unified Social Inbox
- Employee advocacy
- DM automations
- Link in bio tool (Vista Page)
- AI Assistant
- A social listening tool
Must read: Social Listening Analytics: A Complete Guide
What to watch out for with analytics for multi location brands
Even the best social analytics tools won’t do you much good if you fall into the common traps below.
Must read: 20+ Social Analytics Tools in 2025: Free And Paid
Focusing only on global averages
A glowing overall engagement rate may feel like a win, but it can easily mask trouble spots in specific regions.
For example, if one high-performing location skews the LinkedIn and Facebook numbers upward, you may overlook your clients’ other locations that underperform.
Must read: LinkedIn Analytics: Complete Guide [w/ metrics, tools, etc.]
Instead of having tunnel vision, break down your clients’ results by location to get the full picture.
This way, every branch gets the attention it deserves.
Using the same KPIs for every market
Not all metrics have the same weight everywhere.
A spike in YouTube Shorts shares in one region may be a game-changer, while in another, it’s comments that signal real impact.
Must read: YouTube Shorts Analytics Explained: An A–Z Breakdown
Adapt your KPIs to each market’s audience behavior, goals, and competitive landscape to measure what truly matters locally.
Ignoring local context
Numbers don’t live in a vacuum.
Holidays, festivals, local news, and even weather events can dramatically affect your clients’ social media data.
For instance, a dip in engagement can be due to a big local sporting event, not a failed campaign.
Weaving in this local context ensures you accurately interpret the performance of your clients’ multiple locations.
Overcomplicating your dashboards
When analytics reports start looking like spaceship control panels, it’s a problem.
Too much clutter makes it harder to spot key insights quickly.
The key is to streamline your dashboards to highlight the most actionable metrics so your team can make decisions without getting lost in the data.
Not acting fast enough
Analytics aren’t just for post-campaign analysis but also a tool for in-the-moment optimization.
If you wait until the campaign is over to review the numbers, you’re missing opportunities to tweak and improve on the fly.
Conduct real-time results tracking and pivot quickly when you see something working (or not working).
Forgetting to align analytics with business goals
Chasing likes, views, and shares is great for bragging rights, but if those metrics don’t tie back to sales, sign-ups, or other core KPIs, you’re missing the bigger picture.
Always connect your analytics to your clients’ measurable business outcomes so you can prove Return on Investment (ROI) and justify your social media marketing spend.
Not standardizing data collection across locations
If each location is tracking and reporting differently, your comparisons won’t be accurate.
Inconsistent naming conventions, time zones, or tagging can lead to messy data that’s hard to trust (and even make sense of).
Create clear, standardized guidelines so every location is feeding consistent, clean data into your analytics system.
FAQs on analytics for multi location brands
Why is multi location reporting more complex than single location reporting?
Managing many locations isn’t just a scale-up of one account. It’s juggling diverse goals, performance data, audiences, and messaging.
Tools for multi-location analytics reporting help centralize dashboards, streamline comparisons and your workflow, and reveal which of your clients’ locations stand out (or need a hand).
How do you customize reporting for different stakeholders like store managers vs. execs?
You will need tiered reporting to personalize data views and insights, such as
- Local statistics for store managers
- Regional summaries for regional directors
- Aggregated brand-level insights for leadership
Tiered reporting helps you avoid overwhelm and keeps everyone across locations focused on what matters most.
What are the common challenges in multi location analytics?
One of the biggest challenges of multi-location analytics is scaling.
It can be tricky since you’re balancing branding with local personality, syncing regional reporting, ensuring data accuracy, and avoiding information overload, especially when using tools not built for complex analytics across multiple locations.
Mastering growth through analytics for multi location brands
Getting a clear view of your clients’ regional social performance is one of the secret sauces for making each location thrive.
With the right data, you can spot trends, double down on what’s working, and fix what’s not before it impacts your clients’ bottom line.
Vista Social makes it easy to compare, track, and optimize performance across all your clients’ locations from one powerful dashboard.
Ready to uncover the full social media potential of your clients’ multi-location brands?
Create your Vista Social account today and turn insights into action.
Try Vista Social for free
A social media management platform that actually helps you grow with easy-to-use content planning, scheduling, engagement and analytics tools.
Get Started NowAbout the Author

Content Writer
Jimmy Rodela is a social media and content marketing consultant with over 9 years of experience, with work appearing on sites such as Business.com, Yahoo, SEMRush, and SearchEnginePeople. He specializes in social media, content marketing, SaaS, small business strategy, marketing automation, and content development.
Loading related tools...


Tools
PublishingAnalyticsEngagementIntegrations
FacebookInstagramLinkedInRedditSnapchatThreadsTikTokX (Twitter)YouTubeBlueskyVista Page (link-in-bio)All IntegrationsCopyright © 2026 Vista Social LLC. All Rights Reserved.