

Published on October 8, 2026
11 min to read
Zero-Click Social: What to Measure When Nobody Clicks Through

Summarize with AI

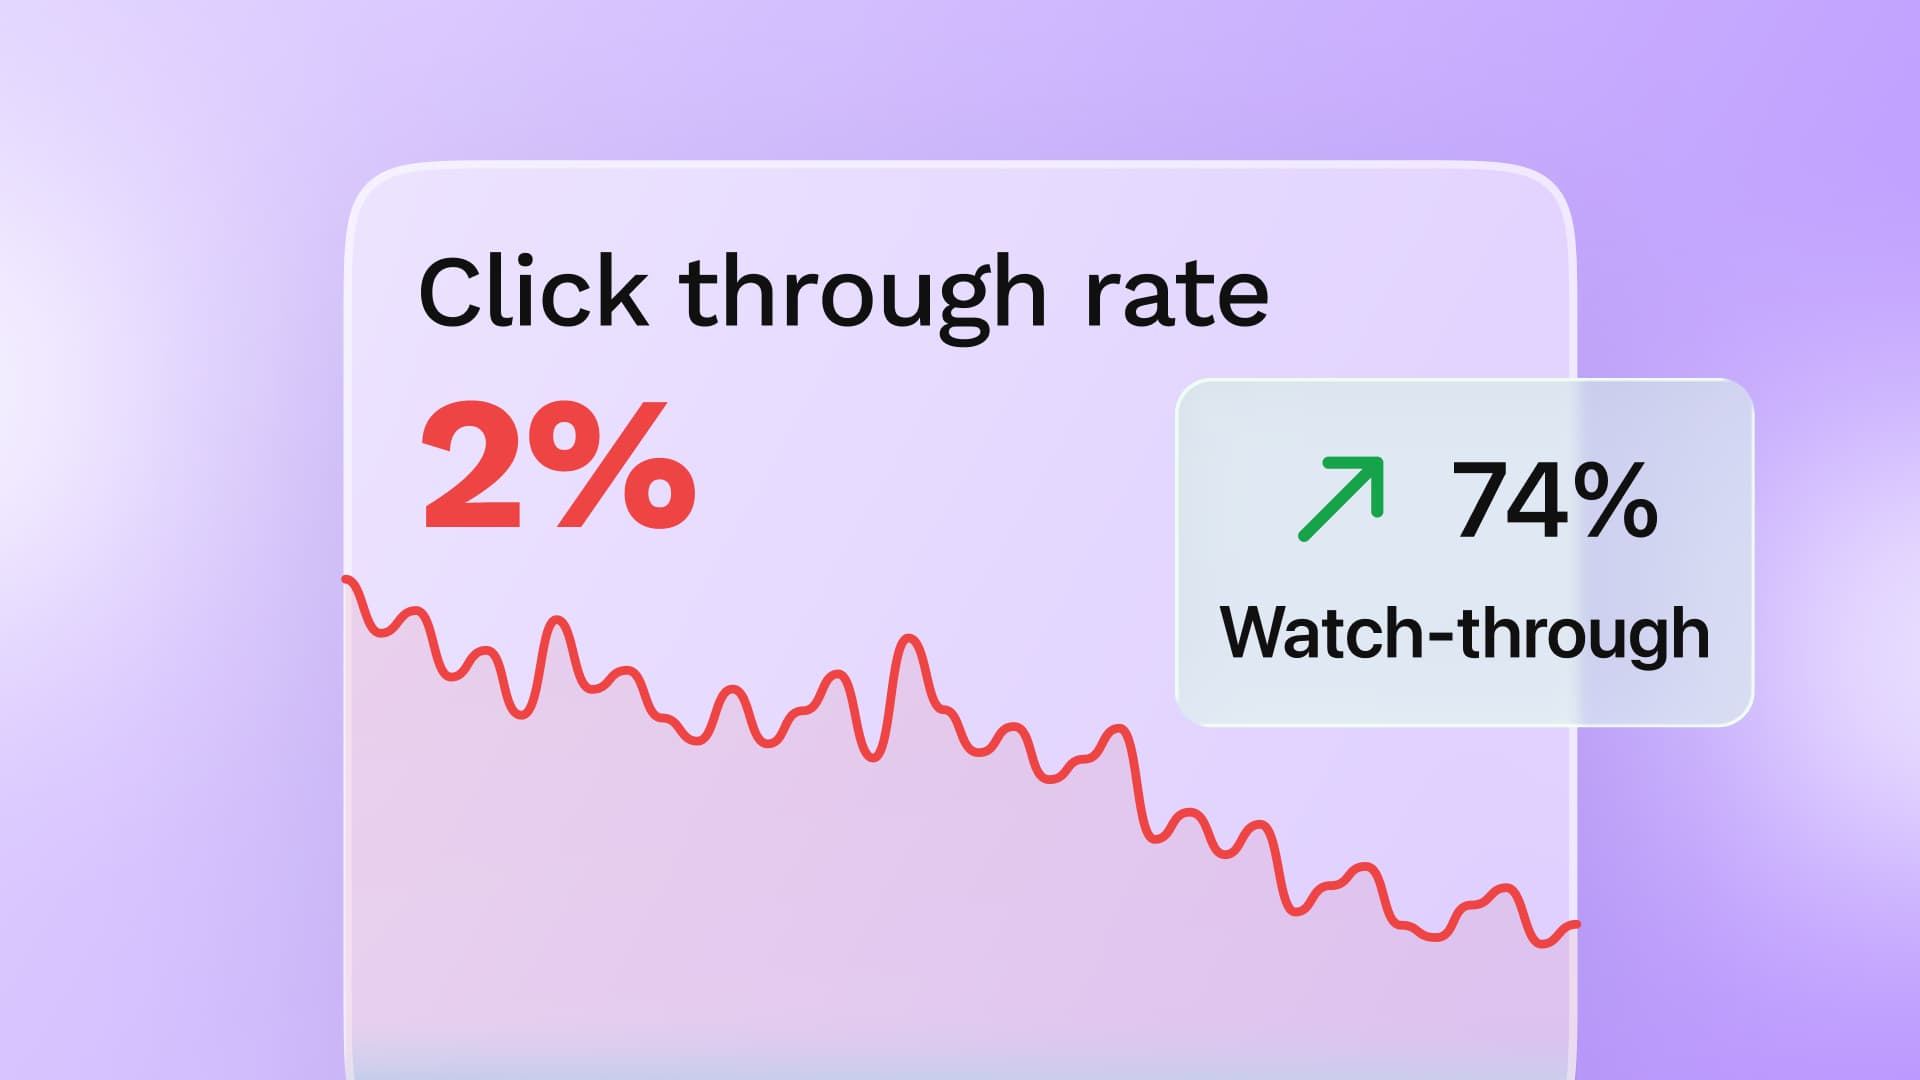
Table of contents
Summarize with AI

ChatGPT

Claude

Perplexity
Share

Vista Social

X (Twitter)


Traffic is the easiest social result to put on a slide, which is why it so often becomes the verdict. Once that line falls, saves, peer sharing, branded demand, sales mentions, and regional context get pushed into the footnotes.
Leadership is right to ask for proof. But a multi-brand social program should offer more than a traffic total followed by regional explanations. It should show what changed, where it changed, how strong the evidence is, and which decision follows.
Zero-click search makes the weakness in the old report harder to ignore. People can learn, compare, share, and form a preference without visiting the site. But the dashboard still treats the visit as the moment social becomes valuable.
This guide shows you how to build a stronger reporting model across brands, regions, and locations. AI can also collect evidence and prepare recurring reports. Your team still sets the definitions, approves the work, and makes the final judgment.
The short version
- Standardize before you summarize: Every brand and region needs the same reporting period, metric definitions, and evidence rules.
- Keep a commercial outcome in view: Revenue, pipeline, qualified leads, or another agreed business result still belongs in the report.
- Add signals that explain influence: Qualified reach, saves, shares, branded demand, conversation, reviews, and self-reported attribution show what happened before the conversion.
- Use AI for the recurring evidence work: Let it collect approved data, flag movement, and prepare the report. Your team verifies the sources and approves the business conclusion.
Table of contents
Why traffic is an incomplete performance measure
Traffic is easy to compare because every market can send the same number. Leadership can see whether sessions rose or fell. The trouble starts when that number is asked to represent the whole social program.
Three breakdowns keep the traffic line in control of the meeting:
| Reporting breakdown | What happens each month | Cost to the program |
|---|---|---|
| The report gets rebuilt | Your team exports data, checks date ranges, chases agencies for context, and recreates the same explanation. | Analysis time disappears because the next report starts from another set of files. |
| Markets use different definitions | One region reports engagement, another leads with video views, and a third treats every mention as positive demand. | Leadership gets more data but cannot compare performance or trust the portfolio view. |
| Useful evidence stays outside the report | Saves, peer sharing, branded demand, and sales notes live in local decks or team messages. | The next brief starts without a shared record of what worked and for whom. |
At that point, measurement becomes a control problem. Leadership cannot defend the program, operators cannot compare performance, and the next campaign begins without the last campaign’s evidence.
The same behavior also extends well beyond social. Search and social platforms increasingly let people consume the useful part before they reach your site. Audience behavior changed before the reporting model did.
How AI changes discovery and attribution
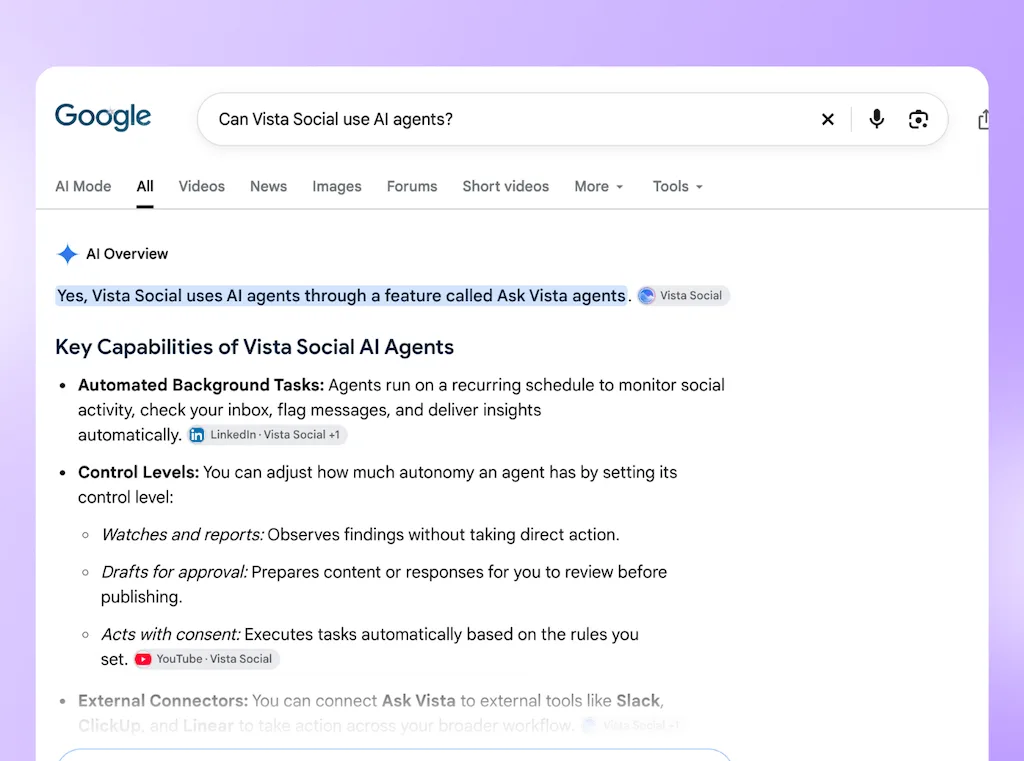
AI answers can surface a brand, compare options, and influence a decision while producing no referral visit. They also expand the number of places where influence can happen before a buyer reaches your owned properties.
They do not explain the entire traffic decline because the pattern is much older. In the same 2026 study, Google’s AI Mode represented 0.34% of searches from January through April.
Social feeds and search features had already trained people to finish more of the buying process elsewhere. So had maps, shopping tools, private sharing, and native video.
Treat AI referrals as a visible minimum rather than a full count. Your analytics can observe a visit from an assistant.
But they cannot see every recommendation, copied answer, private message, or later branded search. The same limit applies to social attribution.
If AI visibility needs its own process, use the LLM visibility guide to audit answers and cited sources. Then connect that work to the social report through shared campaign names, dates, and business outcomes. Do not force every signal into one score.
First-hand evidence still earns attention
Content has to give people something worth remembering, saving, or repeating. A second 2026 analysis of 400 websites found proprietary assets on 92% of the winners. It also found task-completion value at 83%.
Tight topical focus appeared on 75% of winners, but it also appeared on 61% of losing sites. So focus alone was not enough.
For social, the equivalent is first-hand evidence your teams can supply:
- The decision and the tradeoff behind it.
- Results with a baseline, date range, and meaningful limit.
- Customer questions that changed the campaign.
- A regional pattern that only appeared after several markets were compared.
- A useful process the audience can apply without leaving the post.
This evidence improves both the content and the next brief. It helps explain why one campaign earned qualified attention while another produced passive reach. So the team learns from its own work and does not fall back on generic tips.
Six signals for portfolio-level reporting
A useful portfolio report answers three questions. Who did the program reach? What behavior followed?
What business result appeared in the same period? Start with six signal groups, then remove any that do not support a decision.
| Signal | What to track | Portfolio rule | What it cannot prove |
| Qualified reach | Audience roles, industries, seniority, markets, or customer groups. Use the reach and impressions guide to keep the base counts straight. | Use one audience definition and reporting period across comparable accounts. Label lifetime demographic views separately from period-based results. | Seeing the post does not prove consideration or intent. |
| Saves and shares | Saves, public shares, and repeat response to the same theme across several posts. | Compare by brand, theme, and campaign goal. Keep one viral post from distorting the portfolio result. | Private sends stay partly invisible, and neither signal equals a lead or revenue. |
| Branded demand | Branded search, direct visits, demo requests, and self-reported social mentions during the campaign. | Look for the same pattern across several periods and use the social media attribution guide to set the claim boundary. | Movement across several signals still does not give social exclusive credit. |
| Conversation and sentiment | Unprompted recommendations, comparisons, buying questions, objections, and recurring themes. | Review model labels across regional language, humor, and industry terms. Report the theme, volume, source, and caveat together. | A loud conversation may come from a small group, and automated sentiment can be wrong. |
| Review velocity | New review count, rating movement, recurring themes, response time, and the locations or products involved. | Compare like-for-like locations and look for steady reviews that mention the experience promised in the campaign. | A review can sit close to a buying decision without proving that social caused it. |
| Self-reported attribution | A standard “Where did you hear about us?” question with a short list and optional free text. | Keep the wording stable across business units, then compare it with web and CRM data. | People forget or name the final touch, so the answer is useful evidence rather than exact attribution. |
Three rules keep this matrix honest:
- Compare each account with its own baseline before you compare it with the wider portfolio.
- Group brands, regions, or locations only when their goals and audiences are similar enough to support the comparison.
- Label every conclusion as observed, inferred, or still unknown so leadership can see how strong the evidence is.
Build the executive report in four layers
An executive report should make the portfolio easy to compare. It should preserve the proof behind each conclusion and end with a decision. It does not need to compress every platform dashboard onto one page.
Build the monthly report in four layers:
| Report layer | What belongs there | Decision it supports | Required control |
| 1. Executive outcome | One commercial metric, portfolio movement, material risk, and one recommended decision | Does leadership maintain, change, or increase support? | Agreed definition, source system, and reporting period |
| 2. Portfolio comparison | Qualified reach, active response, demand signals, and outliers by brand or region | Where is intervention or deeper investigation needed? | Like-for-like account groups and metric definitions |
| 3. Evidence record | Source widgets, date range, campaign names, regional context, and caveats | Can an operator reproduce and defend the conclusion? | Named owner and review status for every material claim |
| 4. Next action | Test, owner, due date, approval point, and success measure | What changes before the next review? | One accountable owner and a scheduled follow-up |
The social media reporting guide covers the broader process. For this report, resist the urge to add every metric. The executive layer should reveal the outcome, the exception, and the requested decision within a few minutes.
In Vista Social, you can group connected profiles for the brands, regions, or locations that should be compared. Custom reports on Advanced, Scale, and Enterprise can combine sections, hide or rename metrics, and add written context. They also let you save the structure as a reusable template.

Scheduled reports are available on paid plans. You can deliver them weekly, monthly, or once as a PDF or report link.
The report structure supplies control, while the source widgets supply proof. Keep the period, account scope, metric definition, and caveat visible so another operator can reproduce the conclusion.
Automate the evidence work, retain the judgment
The Monday-morning reporting chore usually starts with exports, date checks, profile lists, copied charts, and requests for missing context. Those recurring steps suit AI because the inputs, permissions, and output can be defined in advance.
The business conclusion still needs a person who knows the campaign, market, and stakes. So a useful AI workflow separates the evidence work from the judgment leadership is asked to trust.
| Stage | What the system does | Human control | Visible proof |
|---|---|---|---|
| Observe | A monthly trigger pulls approved profile metrics, post performance, inbox patterns, and benchmarks for the selected period. | An operator confirms account scope, date range, and required fields. | Source widgets and retrieval record |
| Assess | The system compares the current period with the approved baseline and flags material changes, gaps, and outliers. | The operator checks whether the comparison is valid and adds campaign context. | Flagged changes with source references |
| Act | An authorized agent prepares the recurring report and routes it to the correct reviewer. | Permissions limit the accounts and actions available. Nothing publishes without the required approval. | Draft report, named reviewer, and status |
| Verify | The reviewer checks the evidence, edits the interpretation, and approves the executive conclusion. | The Head of Social keeps the final call. | Approved PDF or report link plus next action |
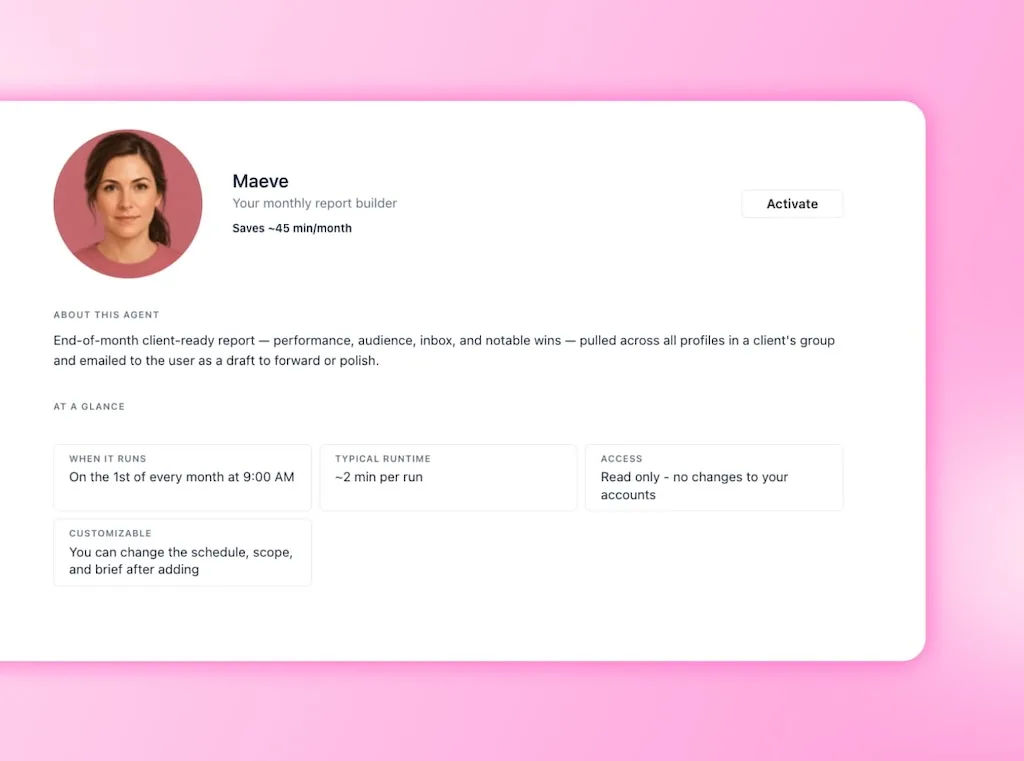
Vista Social’s AI report summary can surface changes, trends, wins, and areas to watch from connected report data. The same three plans include Ask Vista agents for recurring report and monitoring workflows. However, an operator still reviews the result before it supports a business decision.
For teams with an approved external AI environment, Vista Social’s MCP tools can expose daily profile metrics. They can also expose post-performance benchmarks and other approved social data to that client.
The AI can gather and structure the evidence inside a workflow your organization already governs. But permissions, profile scope, approval rules, and human signoff still define what it can do.
Do not ask the system to “tell leadership whether social worked.” Give it the approved sources, comparison rules, and required output. Then require a reviewer to confirm the evidence and write the business meaning.
On the first business day of each month, prepare the prior month’s social report. Use only [approved profile groups] and approved Vista Social report data. Flag material changes in qualified reach, saves and shares, conversation themes, branded-demand proxies, and the agreed commercial outcome against each brand or region’s prior baseline. For every conclusion, show the source metric, date range, profile scope, and any limitation. Do not infer revenue, sentiment, or causation when the source does not support it. Route the draft to [reviewer] for context and approval. Do not send the executive report until the reviewer has approved the conclusion and next action.
Answer the traffic question with evidence
The report cannot manage the meeting for you. So lead with the portfolio outcome, acknowledge the traffic movement, and replace the old view with evidence and a decision.
Open with the portfolio: “Sessions from social fell 18% across the program. Qualified reach improved in three priority markets, branded demand rose in two, and direct pipeline stayed flat. The report now shows those movements together so we can decide where to intervene.”
When they ask, ‘Did social work?’: “The program strengthened influence in these markets and missed the commercial target in these two. I recommend repeating the first pattern and changing the audience and offer in the second.”
When they want one number: “Pipeline remains the business outcome. Qualified reach, active response, and branded demand show where social is building or losing the conditions that produce it.”
When the evidence is incomplete: “We cannot assign the movement to social alone. We can show that the same pattern appeared across these sources. Then the next controlled test will tell us whether it repeats.”
Zero-click behavior cannot excuse weak performance. If reach, response, demand, conversation, and business results all weaken against a useful baseline, the work needs attention. Change the audience, evidence, distribution, or offer instead of rewriting the slide.
Direct-response programs also need a different emphasis. When every post carries a tracked offer, clicks and conversion rate should stay near the top.
The wider evidence can still help diagnose the result. But it should not displace the action the campaign was built to produce.
Frequently asked questions
What is zero-click search?
These searches end on the results page because people get what they need there. On social, native posts, videos, and comments can remove the need for an immediate site visit.
Is AI the main reason social traffic is falling?
AI contributes to the shift, but it does not explain the entire decline. Search features, native posts, map results, private sharing, shopping tools, and video also keep people away from the site. Review the movement across those channels before assigning one cause.
What should a zero-click social report measure?
Keep one agreed commercial outcome. Then add the audience, response, demand, conversation, review, and attribution signals that support a decision. The social media metrics guide can help you define the fields consistently.
How do you standardize zero-click reporting across several brands?
Start with one reporting period, one definition set, and profile groups for comparable brands, regions, or locations. Then require every material conclusion to retain its source, scope, caveat, owner, and review status. Local context can vary without changing the evidence rules.
How do you explain falling traffic without sounding defensive?
State the decline directly, show the wider evidence, and name the decision that follows. Also separate supported conclusions from open questions. Leadership can then see where the program is healthy, where it is weak, and what you will change.
How do you know whether the problem is measurement or content?
Compare the reach, response, demand, and business results with the account’s own baseline and a useful benchmark. Stable influence signals alongside falling clicks point to a measurement gap. But when all of those indicators decline together, improve the work rather than the reporting language.
Try Vista Social for free
A social media management platform that actually helps you grow with easy-to-use content planning, scheduling, engagement and analytics tools.
Get Started NowAbout the Author

Content Writer
Orion loves to write content that refuses to be boring. As part of Vista Social, he helps brands, creators, and agencies stop doom scrolling and start winning with social media. When he's not in front of a keyboard, he's watching films in IMAX with his wife, dissecting football tactics (the European kind), and getting lost in a good book.
Loading related tools...

The most complete social media management platform for teams who demand more.






Tools
PublishingAnalyticsEngagementIntegrations
FacebookInstagramLinkedInRedditSnapchatThreadsTikTokX (Twitter)YouTubeMCPVista Page (link-in-bio)All IntegrationsCopyright © 2026 Vista Social LLC. All Rights Reserved.