New
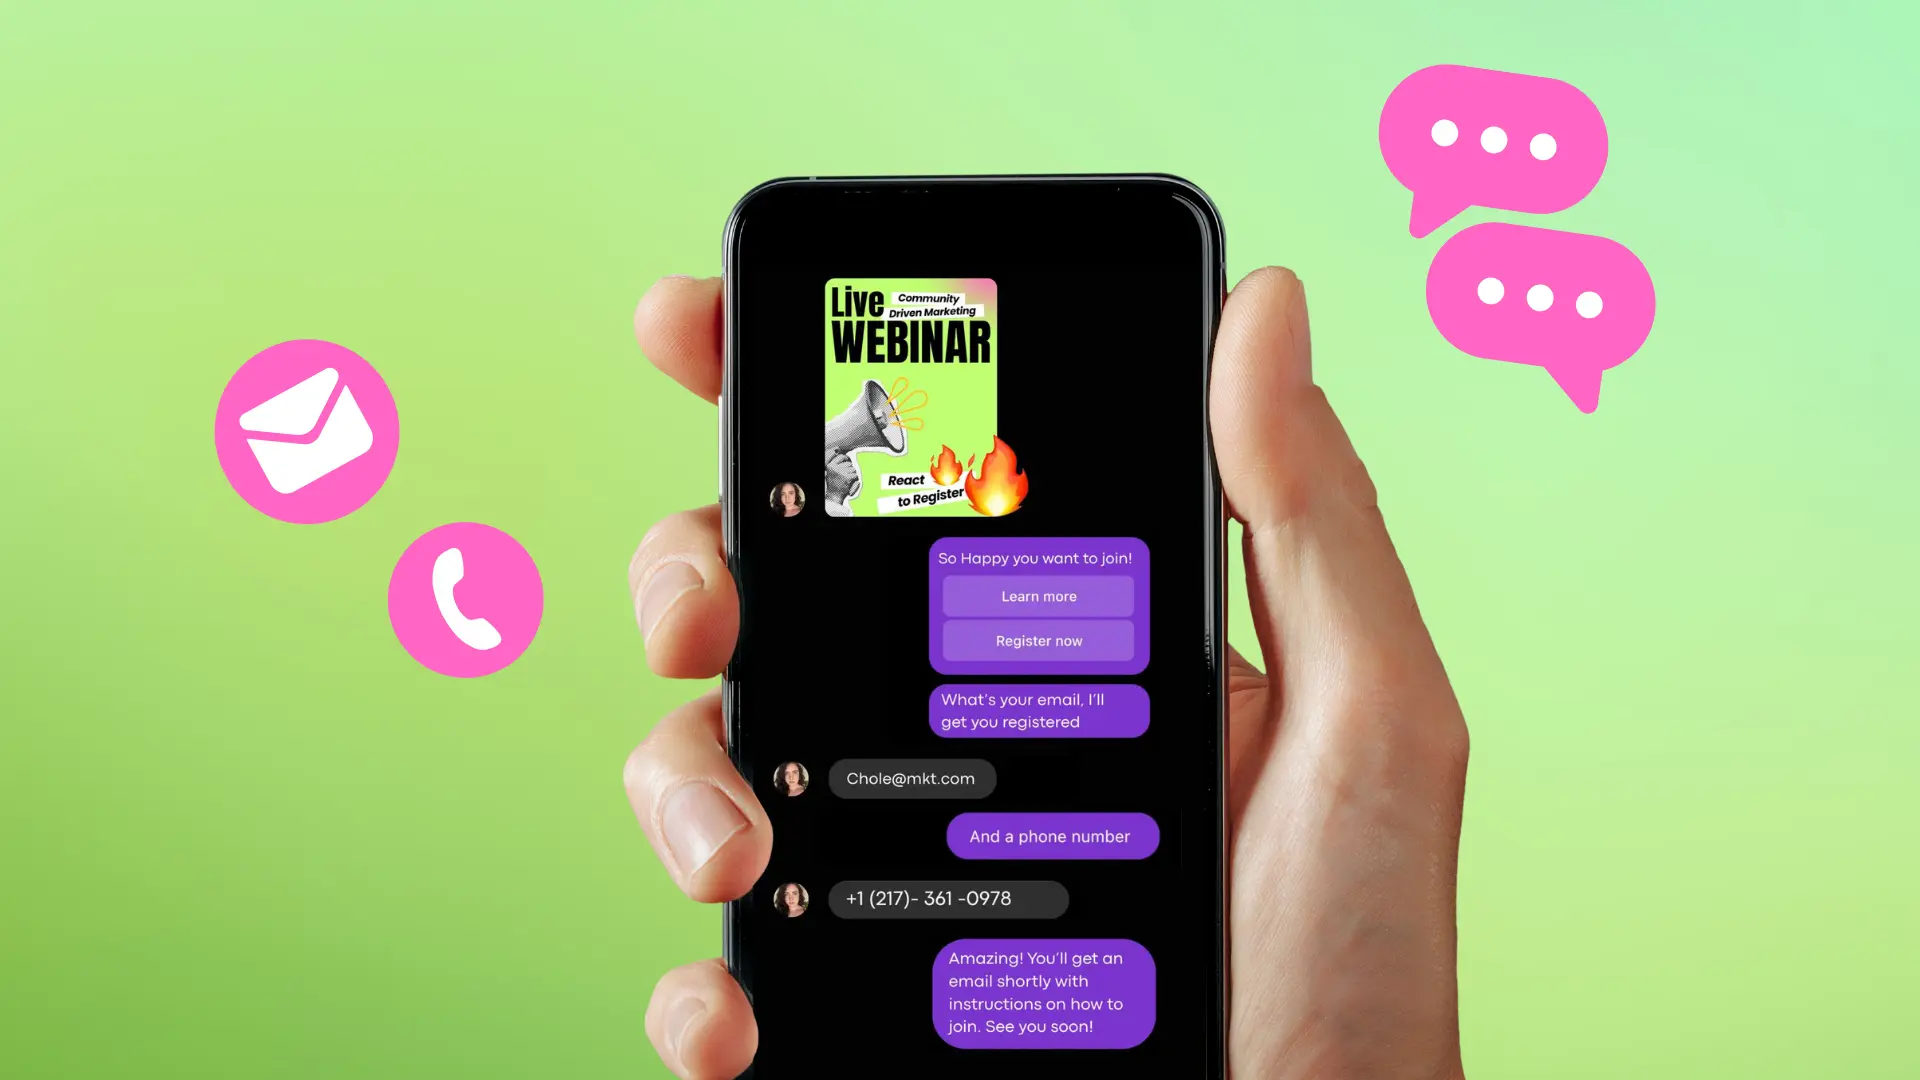
Turn Your DMs Into Lead Gen!
Learn how to collect lead data from your DMs such as email addresses, phone numbers, and more right from your social inbox. If you are not yet automating your DMs your competitors are outpacing you.

How Something Social Saved 75% of Their Time and Increased Revenue by 15%
See how a fast-growing agency improved operations, cut down hours of manual work, and unlocked new revenue opportunities with Vista Social.
New

50 Unique Social Media Ideas for Consistent Content Creation
Discover 50 unique social media post ideas to engage your audience, grow your brand, and maintain a consistent content strategy with ease!
Mastering Content Reuse: The Key to a Consistent and Sustainable Posting Strategy
Published on May 30, 2025
10 min to read
How to Build Effective Social Media Reporting and Analytics Dashboards
Summarize with AI
Summarize with AI
ChatGPT
Claude
Perplexity
Share
Vista Social
X (Twitter)
Table of contents
Summarize with AI
ChatGPT
Claude
Perplexity
Share
Vista Social
X (Twitter)
Most marketers are sitting on a goldmine of data and don’t even know it. 87% say data is their company’s most under-utilized asset, yet the brands winning at social aren’t just posting more content—they’re making smarter decisions with social media reporting and analytics.
While social-first brands with mature strategies see 10.2% year-over-year revenue growth, 22% of marketers still struggle to measure and justify their social work. That disconnect? It’s costing businesses real money.
Social networks drove 17.11% of all online sales in 2025, and we’re heading toward a $1 trillion social commerce market by 2028. Vanity metrics won’t help you capture any of that revenue.
Let’s change that. This guide will walk you through building social media dashboards that actually move the needle—from identifying the right metrics to designing reports that drive real business decisions.
Table of contents
Foundation: Understanding Your Analytics Needs
Building effective social media reporting and analytics starts with understanding who needs what from your data. Your CEO doesn’t care about individual post performance—they want to see how social drives revenue. Your content creator needs engagement patterns to improve their work. Different people, different needs.
Identifying Key Stakeholders and Their Reporting Requirements
Talk to the people who’ll actually use your reports. Find out what decisions they make and what data would help them make those decisions faster or better. A sales manager might need lead attribution data, while customer service wants to track response times and sentiment.
Don’t assume you know what they need. The marketing director who says they want “everything” probably just needs campaign ROI and audience growth metrics. Dig deeper.
Mapping Business Objectives to Social Media KPIs
Too many marketers pick metrics because they’re easy to track, not because they matter. Growing followers feels good, but if your goal is customer retention, you should be measuring existing customer engagement and support interactions instead.
Look at your company’s actual priorities for the quarter or year. If it’s increasing sales, your social metrics should connect to purchase behavior. Building brand awareness? Track reach and mentions. The metrics should make sense for what you’re trying to accomplish.
Distinguishing Between Operational Metrics and Strategic Insights
Some numbers tell you if things are running smoothly—how often you post, how quickly you respond to comments, basic engagement rates. Other data tells you what’s actually working and why—which content types drive conversions, what audience segments are most valuable, how social impacts the customer journey.
Both matter, but they serve different purposes. Operational metrics keep the day-to-day running. Strategic insights change how you invest time and budget.
Common Pitfalls in Dashboard Planning
The worst dashboards try to show everything at once. You end up with a wall of charts that tell you nothing useful. Good dashboards answer specific questions for specific people.
Also, consider how people actually work. If your team makes weekly content decisions, monthly reports won’t help much. If executives review performance quarterly, daily fluctuations just create noise. Match your reporting to real decision-making rhythms.
Essential Metrics Framework
Once you know who needs what, you can focus on the metrics that actually matter. These aren’t the vanity metrics that make you feel good—they’re the numbers that help you understand whether your social media reporting and analytics efforts are moving your business forward.
- Engagement Metrics: Comments, saves, and shares show genuine interest better than likes. Track watch time and completion rates for video content. Calculate engagement rate based on reach, not followers, for accurate performance measurement.
- Reach and Awareness: Focus on reach over follower count. Track share of voice in your industry and monitor branded mentions. Audience quality beats quantity—new followers from your target demographic matter more than random accounts.
- Conversion Tracking: Set up proper attribution tracking with UTM parameters and conversion pixels. Track the full customer journey, not just immediate conversions. Include micro-conversions like email signups and content downloads to optimize your entire funnel.
- Content Performance: Analyze which topics generate meaningful conversations and what formats drive engagement. Measure content performance by business objective, not just likes. Track content lifecycle to identify evergreen opportunities.
- Competitor Benchmarking: Your metrics need context. Monitor competitor strategies and performance patterns. Track share of voice compared to direct competitors to identify improvement opportunities.
Dashboard Design Principles
Having the right metrics means nothing if you can’t present them clearly. Good dashboard design turns raw data into actionable insights that people actually want to use.
Visual Hierarchy and Data Storytelling
Lead with the most important information first. Your stakeholders shouldn’t have to hunt for the metrics that matter most to their decisions. Use size, color, and positioning strategically to guide attention to key performance indicators.
The best dashboards tell a story with data. Start with high-level business outcomes at the top, then provide supporting details for deeper analysis below. If your executive dashboard shows a 15% increase in social-driven revenue, follow that with the engagement and reach metrics that contributed to that growth.
Choosing the Right Chart Types for Different Metrics
Chart selection makes or breaks data comprehension. Line charts work best for showing trends over time—perfect for tracking follower growth or engagement rates across months. Bar charts excel at comparing performance across categories, like post types or platform performance.
Avoid pie charts unless you have three segments or fewer. Nobody can distinguish between 12% and 15% slices. Tables work well for detailed breakdowns, but keep them scannable with proper formatting and highlights on key figures.
Mobile-Responsive Dashboard Considerations
More people check dashboards on mobile than you think. Your CMO might review performance during their commute, or your content creator could check engagement while at a coffee shop.
Design for mobile first, then expand for desktop. This means stacking charts vertically, using larger fonts, and prioritizing your most critical metrics for smaller screens. What looks perfect on a 27-inch monitor might be unreadable on a phone.
Real-Time vs. Historical Data Presentation
Match your data refresh rate to how quickly people need to act on the information. Real-time data works for crisis monitoring and customer service metrics—you need to know immediately if mentions spike or sentiment turns negative.
Historical data serves strategic decision-making better. Monthly trends and quarterly comparisons help with budget planning and strategy development. Don’t overwhelm stakeholders with minute-by-minute fluctuations when they’re making decisions that affect the next quarter.
Technical Implementation with Vista Social
Vista Social makes building effective dashboards much easier than cobbling together data from multiple tools. Instead of logging into five different platforms and manually compiling spreadsheets, you get everything in one place.
Leveraging Vista Social’s Built-In Analytics Capabilities
Vista Social’s unified dashboard shows performance across all your social channels without the usual data wrestling. The platform automatically tracks engagement, reach, and conversion metrics, so you spend time analyzing results instead of collecting numbers.
The cross-platform view reveals patterns you’d miss looking at individual networks. Maybe your LinkedIn posts drive more qualified leads, while Instagram generates higher engagement rates. These insights shape smarter content distribution strategies.
[Must Read: 20+ Social Analytics Tools in 2025: Free And Paid]
Customizing Reports for Different Team Roles and Departments
One size definitely doesn’t fit all when it comes to social media reporting and analytics. Vista Social lets you create role-specific views that give each stakeholder exactly what they need.
Set up executive dashboards focused on high-level KPIs and business impact. Marketing teams get campaign performance breakdowns and optimization insights. Content creators see post-level analytics and audience engagement patterns. Customer service teams focus on mention tracking and response metrics.
Setting Up Automated Reporting Schedules
Manual reporting eats up hours you could spend on strategy and optimization. Vista Social’s automated reporting handles the routine work, generating and sending reports on your schedule.
Configure weekly performance summaries for your marketing team, monthly executive dashboards, and quarterly business reviews. The reports populate with fresh data automatically, maintaining consistency without manual intervention.
Integrating Vista Social Data with Other Business Intelligence Tools
Your social data shouldn’t exist in isolation. Vista Social connects with your existing business intelligence stack, letting you see how social media fits into your broader marketing and sales funnel.
Export data to Google Analytics, HubSpot, Salesforce, or other tools you already use. This integration reveals the complete customer journey, from social discovery to final purchase.
Advanced Analytics Features
Once you’ve mastered the basics, Vista Social’s advanced features help you dig deeper into performance patterns and predict future trends.
Cross-Platform Performance Comparison
Vista Social’s unified dashboard lets you compare how identical content performs across different networks. You might discover that video posts drive 3x more engagement on Instagram than LinkedIn, while thought leadership articles perform better on LinkedIn than Twitter.
These insights optimize your content distribution strategy. Instead of posting everything everywhere, you can match content types to the platforms where they perform best.
Social Media Reporting and Analytics ROI Calculation
Vista Social’s attribution tools help you understand which social touchpoints contribute to conversions throughout the customer journey. Someone might discover you on Instagram, engage with your LinkedIn content, and convert after clicking a Facebook ad.
Traditional last-click attribution misses this complexity. Vista Social’s multi-touch attribution reveals the complete picture, showing how different social activities work together to drive business results.
Sentiment Analysis and Brand Monitoring
Vista Social monitors brand mentions and sentiment across social platforms automatically. You get alerts when sentiment shifts negatively, enabling quick responses to potential issues before they escalate.
The sentiment tracking also reveals which content types and topics generate positive responses versus neutral or negative reactions. This intelligence guides content strategy and helps you avoid topics that might damage brand perception.
Predictive Analytics for Content Planning
Historical performance data becomes powerful when you can use it to predict future results. Vista Social’s insights help you plan content calendars based on data rather than guesswork.
The platform identifies patterns in your top-performing content—optimal posting times, successful content formats, and high-engagement topics. These insights reduce the trial-and-error approach to social media strategy.
Stakeholder-Specific Reporting
Different people need different information presented in different ways. Vista Social’s flexible reporting system creates targeted dashboards for each audience.
- Executive Dashboards: Focus on revenue attribution, brand sentiment trends, and high-level growth metrics that connect to business outcomes. Keep visualizations simple and clear to show business impact at a glance. Include competitive comparisons to provide market context.
- Marketing Team Reports: Provide detailed campaign performance data, audience demographics, and optimization insights. Include competitor benchmarking, channel-specific performance metrics, and trend analysis that guides strategic planning and future campaign development.
- Content Creator Analytics: Show post-level performance data, optimal posting times, and audience engagement patterns. Focus on engagement quality metrics beyond likes and shares—comments, saves, and click-through rates provide better insights into content effectiveness.
- Client Reporting: Use Vista Social’s white-label options to create professional, branded reports ready for client presentations. Structure reports around business objectives rather than just social metrics, showing how social activities support broader marketing goals.
Automation and Efficiency
The best social media reporting and analytics systems minimize manual work while maximizing insight quality. Vista Social’s automation features save hours each week.
Automated Report Generation
Create report templates once, then let Vista Social handle the ongoing data population and distribution. Set up different report types for different stakeholders and schedule automatic delivery.
Automated reporting ensures consistency and timeliness. No more scrambling to compile monthly reports or missing weekly team updates because someone forgot to pull the numbers.
Alert Systems for Performance Thresholds
Configure alerts for both positive and negative performance benchmarks. Get notified when engagement drops below acceptable levels, mentions spike unexpectedly, or conversion goals are achieved ahead of schedule.
Smart alerts help you respond quickly to opportunities and issues. If a post starts going viral, you can amplify its reach. If sentiment turns negative, you can address concerns before they spread.
Streamlined Data Collection and Processing
Connect all your social accounts to Vista Social for automatic data collection across platforms. The system handles API connections, data normalization, and metric calculations without manual intervention.
This automation eliminates the tedious work of logging into multiple platforms and copying numbers into spreadsheets. You get clean, consistent data ready for analysis and decision-making.
Time-Saving Templates and Scheduling
Build report templates for recurring needs—weekly team updates, monthly executive summaries, and quarterly business reviews. Templates maintain consistency while adapting to fresh data automatically.
Schedule reports to arrive when stakeholders need them most. Monday morning team meetings get weekend performance summaries. Monthly board presentations receive updated metrics without last-minute rushing.
Optimization and Iteration
Building great dashboards requires ongoing refinement. Regular optimization keeps your social media reporting and analytics relevant and useful as your business evolves.
Regular Dashboard Performance Reviews
Schedule quarterly reviews with dashboard users to assess effectiveness. Ask stakeholders whether they’re getting the information needed for decision-making. Remove metrics that don’t drive action and add new ones as business priorities shift.
These reviews often reveal blind spots and improvement opportunities you wouldn’t notice otherwise. A content creator might need seasonal trend data, while executives want competitive market share information.
A/B Testing Report Formats and Metrics
Experiment with different visualizations and metric combinations to optimize comprehension and usefulness. What works for executives might confuse content creators, and vice versa.
Test report delivery timing too. Some stakeholders prefer weekly summaries on Monday mornings, while others want monthly deep-dives mid-month when they’re planning next month’s activities.
Incorporating Stakeholder Feedback
Create feedback loops with regular users of your dashboards and reports. Their input reveals practical usage issues and improvement opportunities that data alone won’t show.
Stakeholder feedback also helps prioritize development efforts. If three departments request similar functionality, that’s probably worth implementing before individual feature requests.
Scaling Your Social Media Reporting and Analytics Approach
As your business grows, your analytics needs become more complex. Vista Social scales with you, accommodating new social accounts, additional team members, and expanded reporting requirements.
Plan for growth when designing your initial dashboard structure. Build templates and processes that can handle increased volume and complexity without complete rebuilds.
[Must Read: Mastering Social Media Analytics: How to Create Custom Reports]
Building Effective Social Media Reporting and Analytics: Key Takeaways
Building effective social media dashboards isn’t about cramming every possible metric into a single view. Success comes from understanding what different people need to make better decisions and presenting that information clearly and actionably.
The brands winning at social media reporting and analytics focus on business outcomes rather than vanity metrics. They use comprehensive platforms like Vista Social to automate tedious data collection and spend their time on strategy and optimization instead.
Your social media data should be a competitive advantage, not another spreadsheet to ignore. Start with stakeholder needs, choose metrics that align with business goals, and build dashboards that people actually want to use. With the right approach and tools, you’ll transform social media from a cost center into a measurable growth driver.
P.S. Ready to put these strategies into action? Vista Social is built specifically for marketing agencies, freelancers, and social media managers who want to streamline their workflows and maximize their social media impact. Our comprehensive platform combines advanced analytics with collaboration tools designed to make your reporting more effective and your team more productive.
Experience how Vista Social can transform your social media management approach—sign up today and see the difference professional-grade tools make for your strategy!
Try Vista Social for free
A social media management platform that actually helps you grow with easy-to-use content planning, scheduling, engagement and analytics tools.
Get Started NowAbout the Author
Content Writer
Russell Tan is a content marketing specialist with over 7 years of experience creating content across gaming, healthcare, outdoor hospitality, and travel—because sticking to just one industry would’ve been boring. Outside of her current role as marketing specialist for Vista Social, Russell is busy plotting epic action-fantasy worlds, chasing adrenaline rushes (skydiving is next, maybe?), or racking up way too many hours in her favorite games.
Read with AI
Save time reading this article using your favorite AI tool
Summarize with AI
Never Miss a Trend
Our newsletter is packed with the hottest posts and latest news in social media.

You have many things to do.
Let us help you with social media.
Use our free plan to build momentum for your social media presence.
Or skip ahead and try our paid plan to scale your social media efforts.
P.S. It will be a piece of cake 🍰 with Vista Social
Subscribe to our Newsletter!
To stay updated on the latest and greatest Social Media news. We promise not to spam you!
Enjoyed the Blog?
Hear More on Our Podcast!
Dive deeper into the conversation with industry insights & real stories.
