


Published on August 4, 2025
13 min to read
DM Automation Metrics: How to Measure Success And Optimize Performance

Summarize with AI


Table of contents
Summarize with AI

ChatGPT

Claude

Perplexity
Share

Vista Social

X (Twitter)


Figuring out which DM automation metrics to track to assess performance can make or break your strategy.
After all, if you don’t track the right numbers, how do you know if your clients’ DMs are actually converting, engaging, or just… existing?
The good news is that you don’t need a data science degree to figure it out.
In this post, we’ll break down the must-track DM automation metrics, what they actually mean, and how to use them to optimize the performance of your clients’ automated messages (without the overwhelm).
Let’s jump into it.
Table of contents
What you will learn
- What are DM automation metrics?
- Why measuring DM automation metrics is crucial
- What are the key DM automation metrics to track to determine success?
- Analyze DM automation metrics easily with Vista Social
- DM automation metrics: Best practices to turn insights into impact
- FAQs on DM automation metrics
- Master the art of tracking DM Automation metrics to drive better results
What are DM automation metrics?
DM automation metrics are Key Performance Indicators (KPIs) that help you track the effectiveness of your automated direct messages.
The metrics can show you whether the DMs you create for your clients are effective, such as capturing leads, driving engagement, or moving people further down the sales funnel.
DM automation metrics go beyond counting the number of messages you’ve sent.
They can help you determine whether:
- People are opening or responding to your DMs
- Your automated replies lead to clicks or conversions
- Your automated DMs improve customer response times
Essentially, DM automation metrics give you the data you need to make smart decisions, so you’re not just guessing, but optimizing every step of your message strategy.
Why measuring DM automation metrics is crucial
If you’re using DM automation but not tracking the results, you’re flying blind.
Must read: DM Automation for Agencies: Scaling Client Engagement Without Burnout
Sure, your automated messages are going out, but are they doing anything?
Are people engaging, clicking, or ghosting?
You won’t know unless you measure.
Below are several compelling reasons why measuring your DM automation metrics matters.
You’ll know what is working or not
Without metrics, you’re stuck hoping your messages are hitting the mark.
By tracking key metrics, you’ll know which DMs are getting responses, which CTAs are getting clicked, and which workflows are leading to conversions.
Must read: How to Set Up Your DM Automation Workflow
Let’s say a welcome DM you set for your client’s online shop gets a 60% reply rate, but your promo message is barely noticed.
That’s a clear sign to adjust your offer or timing.
Remember: Insight = action, and action = results.
You can improve the customer experience
No one likes feeling like they’re talking to a robot.
By tracking response times, message drop-off rates, or the frequency of user replies to your automations, you can identify where the experience falls short.
For example:
- If people stop responding after the second message, your DM automation sequence or flow may be too long
- If open rates are low, your first line may need more punch to entice recipients into clicking and reading your message
Great automation still feels human, and tracking the right metrics can help you gain valuable insights into how to achieve that.
You can stop wasting time and leads
Every DM has potential.
However, if your DM automations aren’t converting or capturing leads, that potential goes to waste.
Measuring DM automation performance based on essential metrics lets you:
- Spot bottlenecks in your DM automation flows
- Identify high-intent leads
- Avoid sending repetitive or irrelevant messages
For your busy social team, that means no more wasting hours on automations that don’t deliver.
Instead, your precious time is spent where it can have the most impact.
You can prove the ROI of your efforts
When you’ve got solid metrics such as reply rates, conversion rates, and lead volume, you’ll have a clear view of whether your automated DMs drive your expected results.
Plus, if you ever want to expand your automation strategy or invest in new tools, metrics are the data-backed proof you’ll need to justify it.
What are the key DM automation metrics to track to determine success?
Tracking the right DM automation metrics is how you go from “I think this is working” to “Yep, here’s the data to prove it.”
While the specific KPIs you should track may vary depending on your goals and DM automation strategies, it is essential to keep an eye on the crucial metrics listed below.
Open Rate
The open rate is the percentage of users who open your automated DM after it’s sent.
The metric tells you how strong your message’s first impression is.
If your open rate is low, people may be ignoring your message, or it’s landing at a bad time.
One way to improve your open rates is to create variations of your automated message’s greetings, emojis, and send times.
You can then check which versions get the best results in terms of increased visibility and interest.
Reply rate
The reply rate is the number of users who reply to your automated DMs.
The metric shows how engaging or relevant your automated message is.
A high reply rate can indicate that your automated DMs are driving real conversations and potential leads.
To help boost reply rates, ensure your automated messages are conversational and ask questions to encourage responses.
Additional tip: Steer clear of creating messages that sound too “salesy” since this can seem aggressive and spammy to audiences.
Trigger rate
The trigger rate measures how often your DM automation is activated based on a specific action, such as a user clicking a CTA, sending a keyword, or commenting on a post.
Must read: How to Use DM Automation to Convert Comments into Customers
Tracking your trigger rate is crucial because if nobody’s triggering your DM flow… well, the rest of your automation doesn’t even get a chance to shine.
A low trigger rate could mean that your CTA isn’t clear, your keyword isn’t intuitive, or your clients’ audiences just aren’t biting.
You can improve your automated DMs’ trigger rates by:
- Using simple, common language for keyword triggers
- Testing variations of CTAs such as “Comment ‘YES’ to learn more” or “Send ‘DISCOUNT’ to unlock your code”
- Placing your trigger prompts where they’re hard to miss (such as right in your clients’ captions or Story stickers)
Monitor your trigger rate weekly, as small changes in wording can significantly impact the number of users who activate your DM automation flows.
Click Through Rate (CTR)
The CTR is the percentage of users who clicked on a link inside your automated DM.
Tracking the CTR can tell you if your message is compelling enough to drive action, whether you want to get audiences to click a product, landing page, or form link.
Increase CTR by using strong and clear Calls-to-Action (CTAs) and ensure the links are easy to find and tap (especially on mobile devices).
Conversion Rate
The conversion rate is the percentage of users who completed a desired action, such as signing up, downloading, or making a purchase, after interacting with your automated DM.
The conversion rate helps you connect the performance of your DMs to business outcomes—the ultimate success metric.
Ensure your DM automation flow naturally leads to conversion, and that landing pages are optimized for mobile and aligned with your message.
Response Time
The response time shows how quickly your automation sends off replies after a trigger (such as a DM or keyword).
The faster your clients can send a response, the higher the chances of improving the user experience, which in turn boosts customer satisfaction.
You can help improve response times by setting triggers for instant or near-instant replies.
Remember that long delays = missed opportunities.
Drop Off Rate
The drop-off rate is where users stop engaging in your DM sequence or funnel.
A high drop-off rate at a specific step can mean that your message is either confusing, too pushy, or not valuable enough for recipients to continue interacting with.
To reduce high drop-off rates, consider shortening your DM automation flow and simplifying the language.
You can also revise that specific message to make your automated DM more engaging.
Lead Capture Rate
The lead capture rate is the percentage of users who provide their information, such as their email address and phone number, via your DM automation flow.
Capturing leads is often the primary goal of DM automations.
The metric can tell you how effectively your DM automation system converts your clients’ chats into contacts.
Must read: How to Use DM Automation to Convert Comments into Customers
You can boost the chances of your DM automations chances of capturing leads by making your messages easy and non-invasive for people to share information.
You can also offer something valuable in return, such as a discount, a free item, or exclusive access.
Opt In Rate
The percentage of users who give consent to receive a follow-up message, email, or text is known as the opt-in rate.
Consent (Opt-in) is not only essential for compliance (hello, GDPR!), but it also reflects trust and interest.
Ensure that your automated messages are clear and upfront about what users are signing up for, and use friendly, human language.
Sentiment Score
The sentiment score is a measure of whether user responses to your automated DMs are positive, neutral, or negative.
Many DM automation tools or platforms can automatically detect sentiment in incoming messages, allowing you to determine the emotions behind responses in a snap.
Understanding sentiment is important because even if people reply, negative feedback can signal a poor user experience.
Turn negative or even neutral sentiment into a positive one by making your automated messages’ tone warmer, less robotic, and more aligned with your clients’ brand voices.
Re engagement Rate
The percentage of users who previously disengaged but later resumed the conversation is known as the re-engagement rate.
The metric helps you gauge the success of win-back or reactivation flows in your DM automation strategy.
Must read: DM Automation Strategies, Do’s And Don’ts
You can increase your re-engagement rate by using time-delayed follow-ups and offers to bring people back into the conversation.
Keyword Trigger Effectiveness
The keyword trigger effectiveness metric measures how often a specific keyword or trigger phrase results in your automated DM’s intended response or action.
It shows how intuitive and responsive your DM flows (based on relevant keywords) are.
To ensure your automated DMs’ keyword triggers are effective, fine-tune them based on actual user behavior and Frequently Asked Questions (FAQs).
For example, if users frequently type “shipping info” instead of “delivery,” updating your DM automation flow’s keyword triggers to include both ensures they get the right response every time.
New Subscriber Rate via DM
The new subscriber rate is the number of fresh email or SMS subscribers that came directly from your clients’ DM interactions.
DMs are a goldmine for growing your clients’ email lists, making this metric crucial in tracking how well you’re leveraging your automated messages to increase the number of people who become contacts.
Consider offering simple opt-in messages and rewards, such as discounts or free content, to boost sign-ups.
Notification click rate
If your platform sends push notifications for DMs, the notification click rate tracks how often users click them to open your message.
The metric tells you if your notifications are grabbing attention or getting ignored.
Get more DM alert clicks by creating punchy, curiosity-driven first lines that spark interest right from the notification preview.
Time to Conversion
The time to conversion is the average time it takes from the first DM interaction to final conversion.
The metric helps you understand the customer journey length and where your DM automation flow may be losing momentum.
One way of speeding up the path is by tightening your DM flows or offering clearer next steps earlier in the conversation.
For example, instead of waiting until message three to ask for an email or provide a link to a product, move that CTA to the front (when relevant).
This way, users don’t lose interest or drop off before they reach the CTA and miss the chance to act on it.
Analyze DM automation metrics easily with Vista Social
Vista Social makes it easy to launch and manage your DM automations AND measure their performance with actionable data.
Whether you’re running auto-reply campaigns for clients on Instagram, collecting leads via TikTok DMs, or using ready-to-go templates for comment triggers, you can track key metrics directly in your dashboard.
Must read: Instagram DM Automation: The Complete Guide
Click on the Inbox option on the left-hand side menu and select DM Automations.
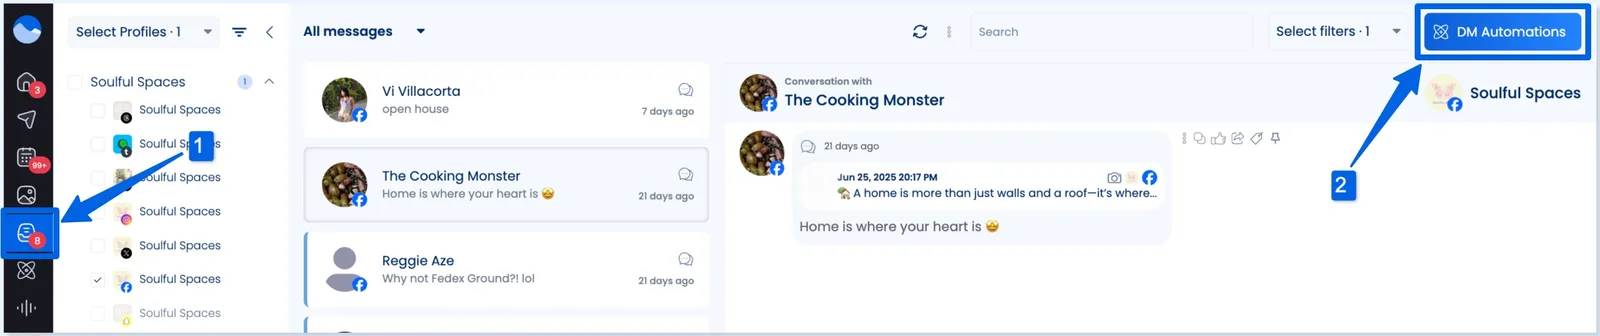
Must read: Real-Time Inbox Moderation Made Easy with Vista Social
You can also click Create from the menu and select DM automations.
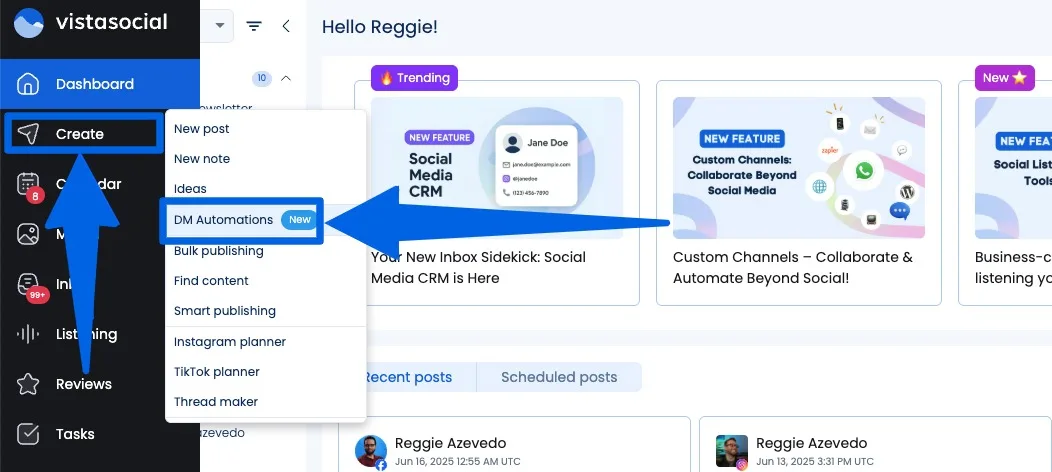
On the DM automations page, you should see your dashboard.
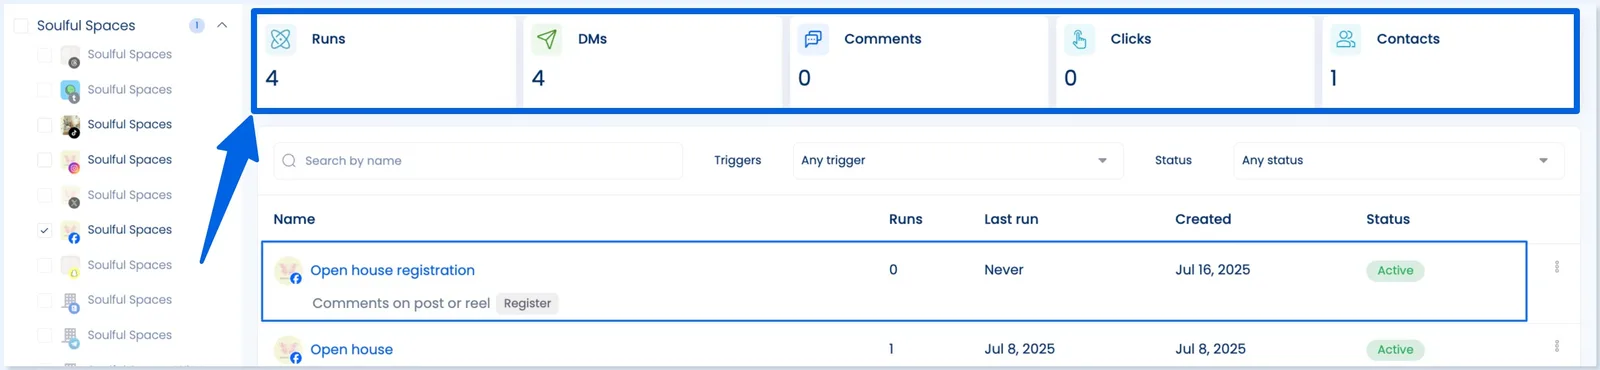
The main dashboard includes a summary of the following:
- The total number of times your DM automation flow was run (Runs)
- The total number of DMs
- The total number of comments
- The total number of clicks
- The total number of contacts
Must read: How to Manage Instagram Live Comments in Real Time with Vista Social
You can also get a quick overview of the following data for each DM automation flow, including the following:
- Runs: The number of times your automation has been triggered
- Last Run: The date when the automation had the most recent activity
- Created: The date your automation was initially set up
- Status: Shows your automation’s current status (Active, Inactive, etc.)
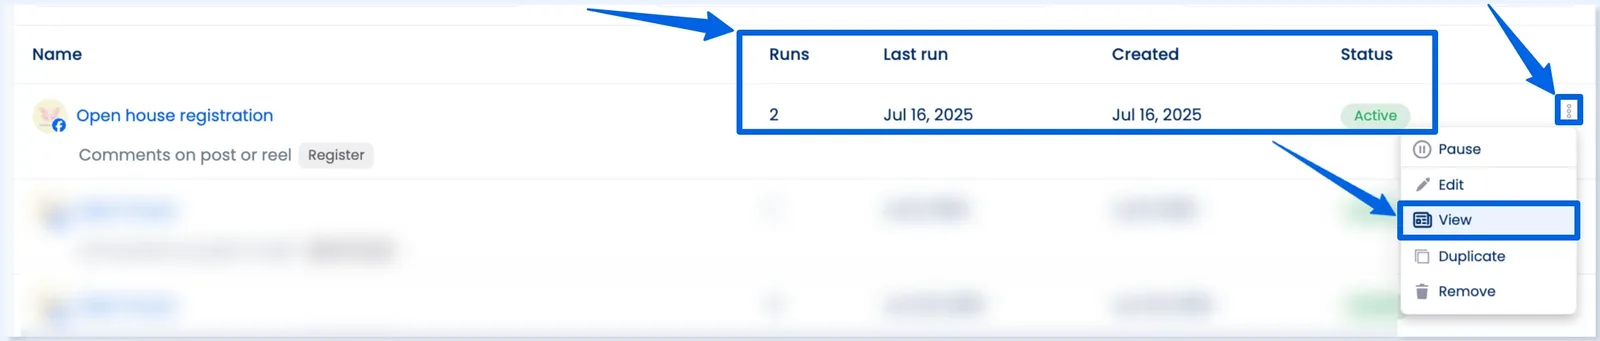
To get a more detailed view of your DM automation’s data, click the three dots icon and select View.
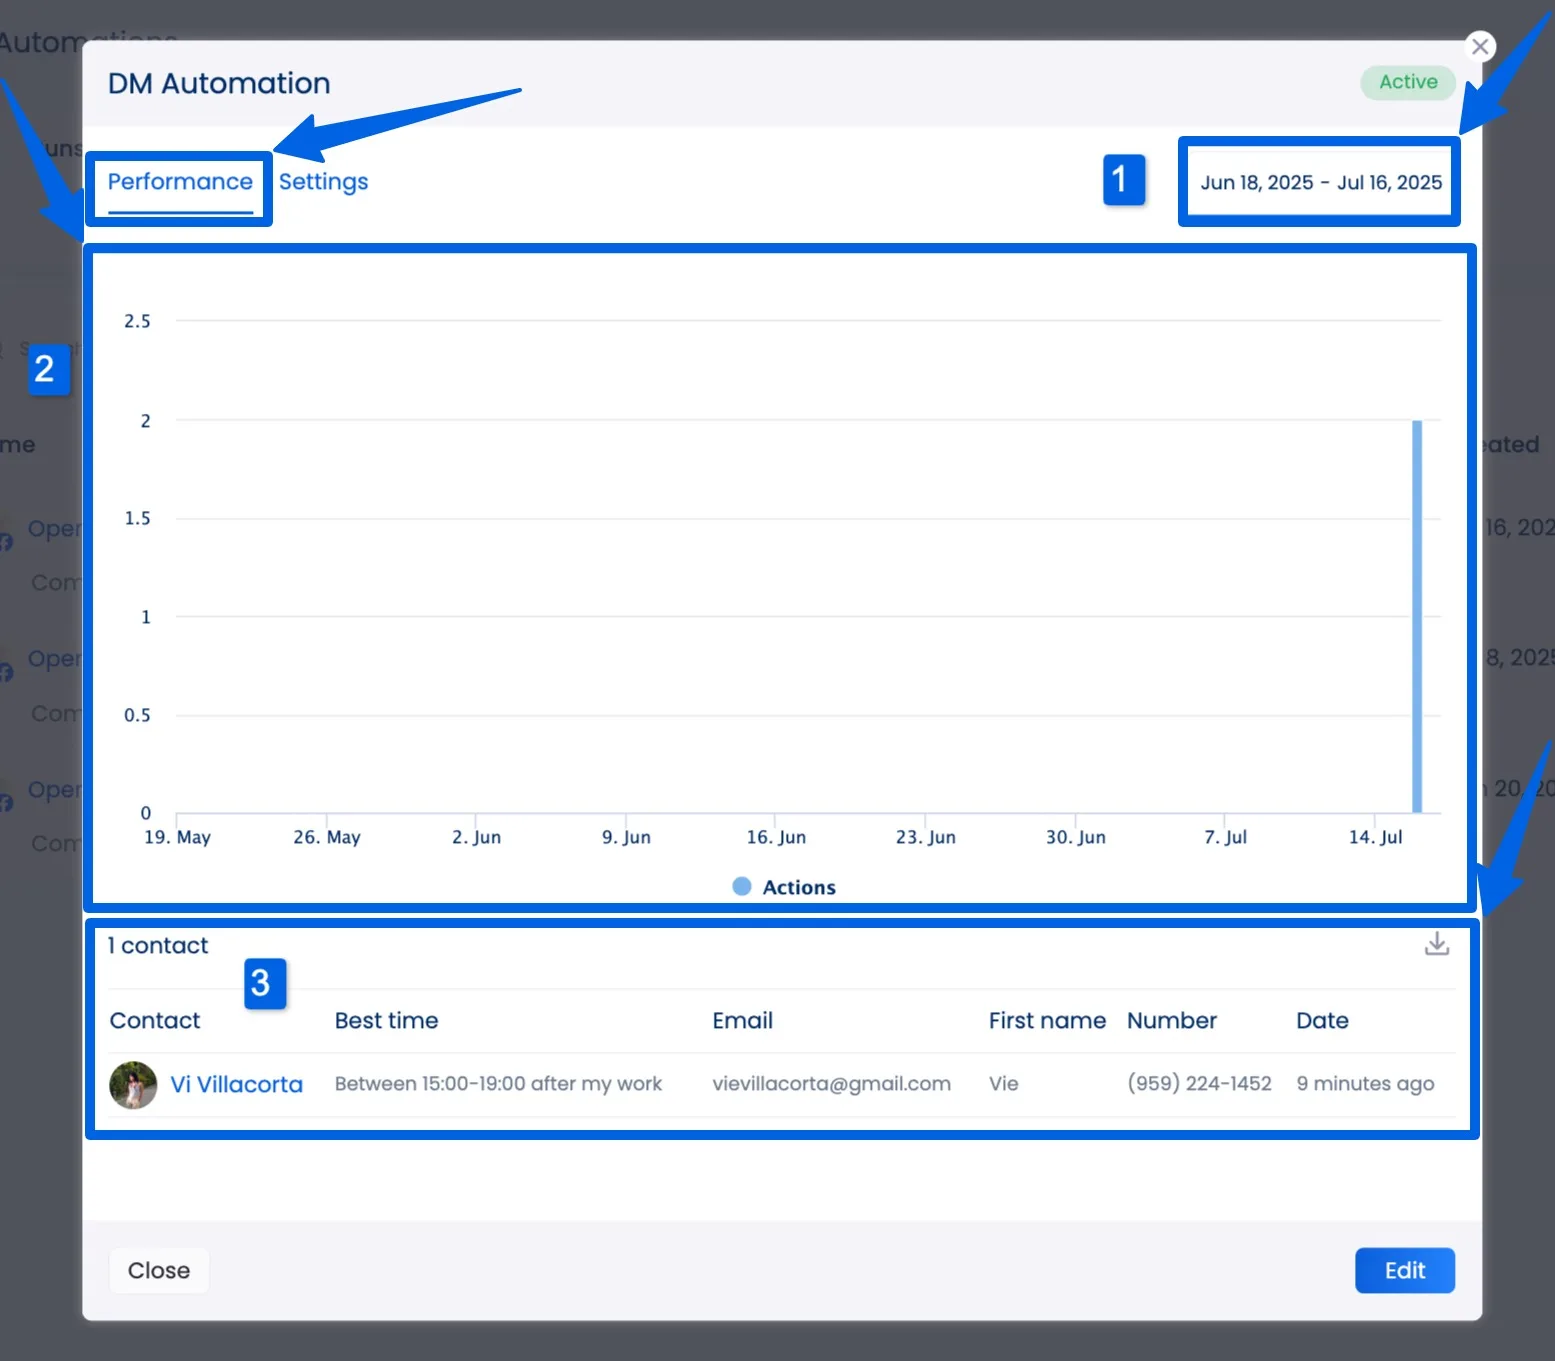
On the Performance tab, you can see the following:
- Date Range. You can set a date range to view the performance of your DM automation during a specific period
- Performance Chart. This shows the number of times the automation was triggered during your selected date range
- Contact Responses. This chart displays all the user data collected through your DM automation flow
Click the Settings tab to view a breakdown of your automation’s configured triggers and actions. You can also see the exact messages that your clients’ audiences will get.
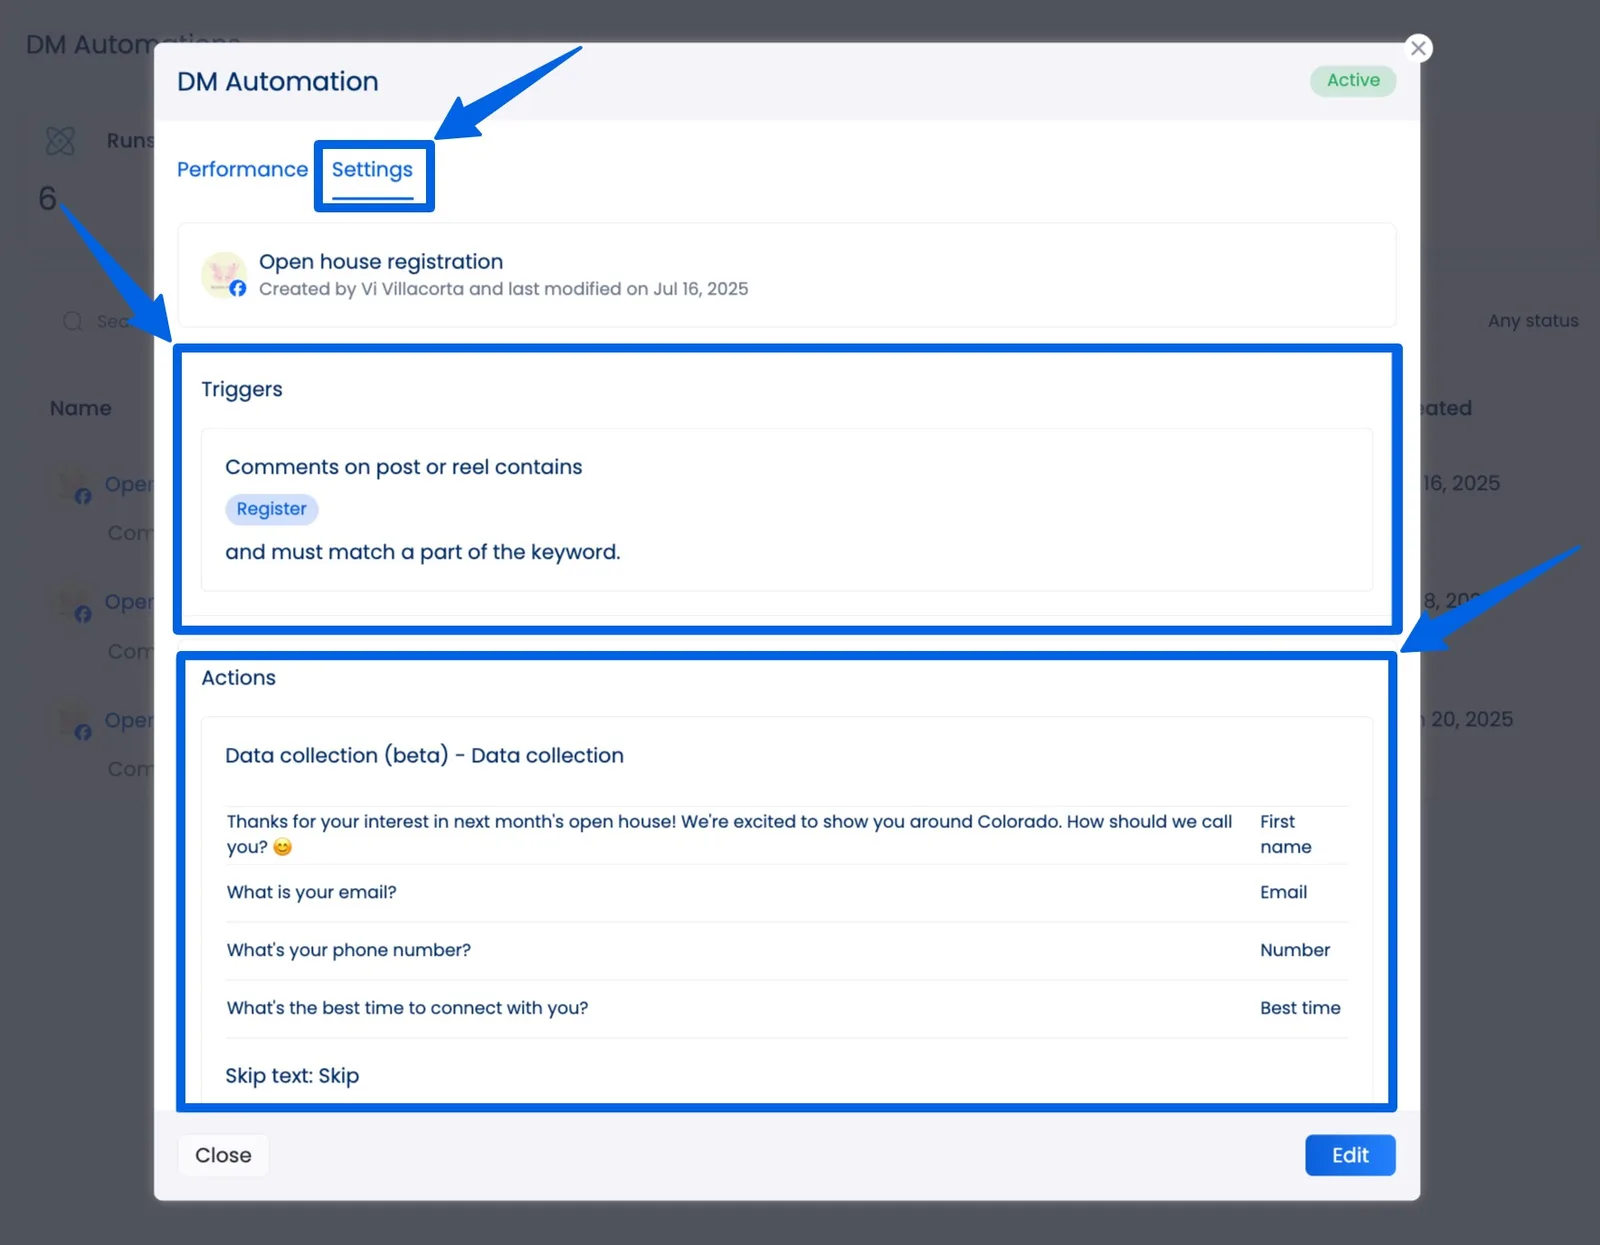
If you enabled the Data Collection options in your DM automations actions to collect data (such as names, emails, or other details via keyword triggers), Vista Social displays the number of responses captured for each field.
Once you’ve reviewed your DM automation metrics and data, you can:
- Double down on top-performing templates by reusing or modifying them for future campaigns to save time
- Tweak underperforming messages, such as changing the copy, call-to-action, or timing
- Test new triggers using Vista Social’s ready-to-go templates, which you can pair with link shorteners for easier tracking
DM automation metrics: Best practices to turn insights into impact
Tracking is only half the game.
The real magic happens when you use DM automation insights to improve your strategy, boost customer engagement, and get results that make your clients do a happy dance.
Below are several tips and tricks to squeeze the most out of your DM automation data insights.
A/B test your flows
Don’t just set one version of your DM automation sequence and hope for the best.
Must read: Smart DM Automation Sequences That Actually Work (with Examples)
Create multiple variations of your DM flows with various greetings, CTAs, button options, or message timing, and test them side by side.
For instance, you can use “Want help choosing a product?” vs. “Need a hand finding the right fit?” as opening questions.
Then, compare the open rates, click-through rates, and response rates between versions to see which one performs best.
Even small tweaks can lead to significant improvements in performance, so let the data guide your decisions, not your instincts.
Map metrics to goals
Before you optimize your DM automation flows and content, determine what you want to achieve.
For example:
- If your client wants more leads, focus on metrics such as CTR, opt-in rate, and conversion
- If your client’s goal is brand engagement, keep a close eye on response rate and conversation depth
- If your client is prioritizing customer satisfaction, track drop-off rates and sentiment in replies
Aligning your DM metrics with your clients’ broader business goals ensures you’re not just collecting data but actually using it to move the needle.
Optimize your timing
Your clients’ audiences aren’t glued to their phones 24/7 (well, most of them).
Gain insights into your DM automation metrics to find out when your clients’ followers are most active and responsive.
You can check platform analytics or DM automation platform reports to spot high-engagement windows.
Once you have clear insights, schedule your messages for those sweet spots, such as during commute hours or lunch breaks.
Remember: The “best time to send” may vary for product drops vs. customer support messages, test and adapt by campaign type.
Use personalization tokens
Automated doesn’t have to feel robotic.
Personalization tokens let you insert names, interests, or recent actions into your automated DMs like this:
“Hey Taylor! We saw you checked out our summer collection ☀️—want to see the bestsellers?”
These small personal touches can significantly boost your open and click rates.
However, keep it natural.
Too much personalization (“Hi Taylor, from Brooklyn, who loves yoga and oat milk lattes…”) gets creepy fast.
Automate the right messages
Automation is powerful, but not every DM should be handled by a bot.
It’s best to automate responses for:
- Welcome messages
- Lead magnets or promos
- FAQ responses
- Product recommendations
But when it comes to billing issues, upset customers, or high-touch sales conversations, bring in a human.
A smooth hand-off between bot and human builds trust and keeps the user experience positive.
FAQs on DM automation metrics
Should you rely only on numbers to judge success?
Numbers play a huge part in the story, but they don’t always give you the entire picture.
Combine metrics with a human check-in, monitor sentiment, and review support team notes to ensure your DM automations are on-brand and provide the help that users need.
How often should you review your DM automation metrics?
Reviewing your metrics weekly or monthly helps you spot trends, catch drop-offs early, and ensure that your messages are still doing their job.
A weekly review is ideal for fast-moving campaigns, such as product launches or Facebook promotions, while a monthly check-in works well for evergreen flows.
Must read: Facebook DM Automation Guide: Steps, Tools, & Tips
Either way, you’ll want to examine key data, including reply rates, trigger performance, and conversions, and then adjust your flows based on what works (or doesn’t).
How do you know if your DM automation keywords are working?
Check your trigger rate. The metric indicates how frequently your keyword-based automation is activated.
For example, if people are typing “pricing info,” but your automation only responds to the word “pricing,” it won’t trigger the response.
That’s a missed opportunity.
Keep an eye on the words people actually use in DMs or comments, and adjust your keyword triggers to match real user behavior.
The more natural your keywords feel, the more likely your automation will fire exactly when it should.
Master the art of tracking DM Automation metrics to drive better results
Tracking and analyzing your DM automation metrics is crucial for understanding what resonates with your clients’ audiences and identifying areas for improvement.
By focusing on performance data, you can fine-tune your messaging, optimize campaign timing, and ultimately boost engagement across social media platforms.
Start measuring smarter and automating better with Vista Social, your all-in-one solution for DM automations, performance analytics, and social media management.
Try Vista Social for free
A social media management platform that actually helps you grow with easy-to-use content planning, scheduling, engagement and analytics tools.
Get Started NowAbout the Author

Content Writer
Jimmy Rodela is a social media and content marketing consultant with over 9 years of experience, with work appearing on sites such as Business.com, Yahoo, SEMRush, and SearchEnginePeople. He specializes in social media, content marketing, SaaS, small business strategy, marketing automation, and content development.
Loading related tools...


Tools
PublishingAnalyticsEngagementIntegrations
FacebookInstagramLinkedInRedditSnapchatThreadsTikTokX (Twitter)YouTubeBlueskyVista Page (link-in-bio)All IntegrationsCopyright © 2026 Vista Social LLC. All Rights Reserved.