


Published on December 17, 2025
9 min to read
The Complete Instagram Analytics Guide for SMMs

Summarize with AI


Table of contents
Summarize with AI

ChatGPT

Claude

Perplexity
Share

Vista Social

X (Twitter)


Social media managers know that creating great Instagram content is just the start. The real power comes from reading your analytics data correctly. Your Instagram metrics tell a story about what works and what doesn’t.
Many SMMs check their numbers but struggle to see the bigger picture. They see follower counts and likes but it can be difficult to connect the dots. It’s important to learn how to use analytics to guide every decision they make.
This guide will show you how to read your Instagram analytics like a pro. You’ll learn which metrics matter most and how to turn data into better results.
Table of contents
Why are Instagram analytics important?
Instagram analytics give you the roadmap to success. Without them, you’re driving blind through your social media strategy.
Here are just a few of the reasons why keeping tabs on your Instagram performance is a must.
Track what actually drives results
Your gut feeling about content performance often lies to you. Analytics show the real truth about which posts drive engagement and which ones fall flat.
The data helps you spot trends you’d never notice otherwise. Maybe your audience loves carousel posts on Tuesdays. Or perhaps video content performs better than photos for your brand.
You wouldn’t have this information without paying attention to patterns amongst top posts in your Instagram analytics.
Make smart budget decisions
If you’re running Instagram ads, analytics become even more critical. You need to know which campaigns deliver the best return on investment.
Social media analytics tools help you track spending across different post types and audiences. This data guides where you should invest more money and where you should cut back.
Stay ahead of your competition
Your competitors likely use Instagram analytics to guide their strategy. Don’t let them get ahead.
Analytics show you what content formats work best in your industry. This data gives you a huge advantage over brands that guess at their strategy.
Prove your social media ROI
Your boss wants to see real results from your Instagram efforts. Analytics provide the proof you need to show success.
Clear metrics demonstrate how your Instagram strategy supports business goals. Whether that’s brand awareness, website traffic, or lead generation, the data tells the story.
How to access Instagram analytics: Two ways
Getting your Instagram analytics data is easier than most SMMs think. You have two main options to choose from.
How to access Instagram’s built-in insights
Instagram gives you free analytics through their built-in Insights feature. This tool shows basic performance data for your posts and account.
Here’s how to find your Instagram Insights on your phone:
Start by opening the Instagram app and go to your profile. Click on the button that says Professional dashboard.
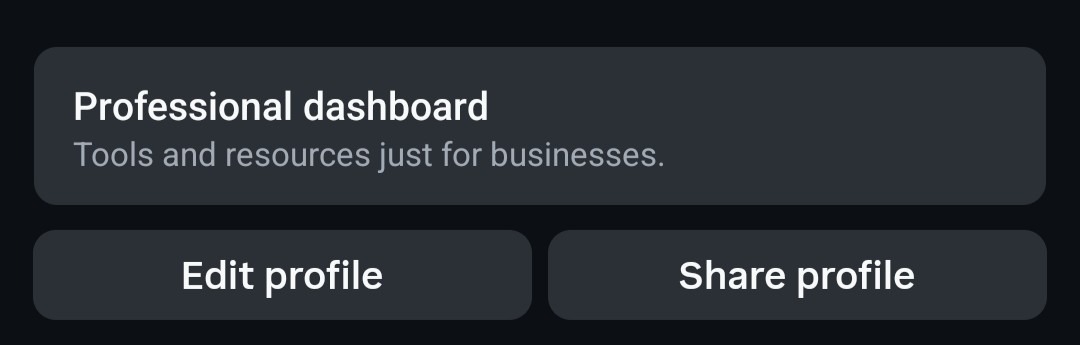
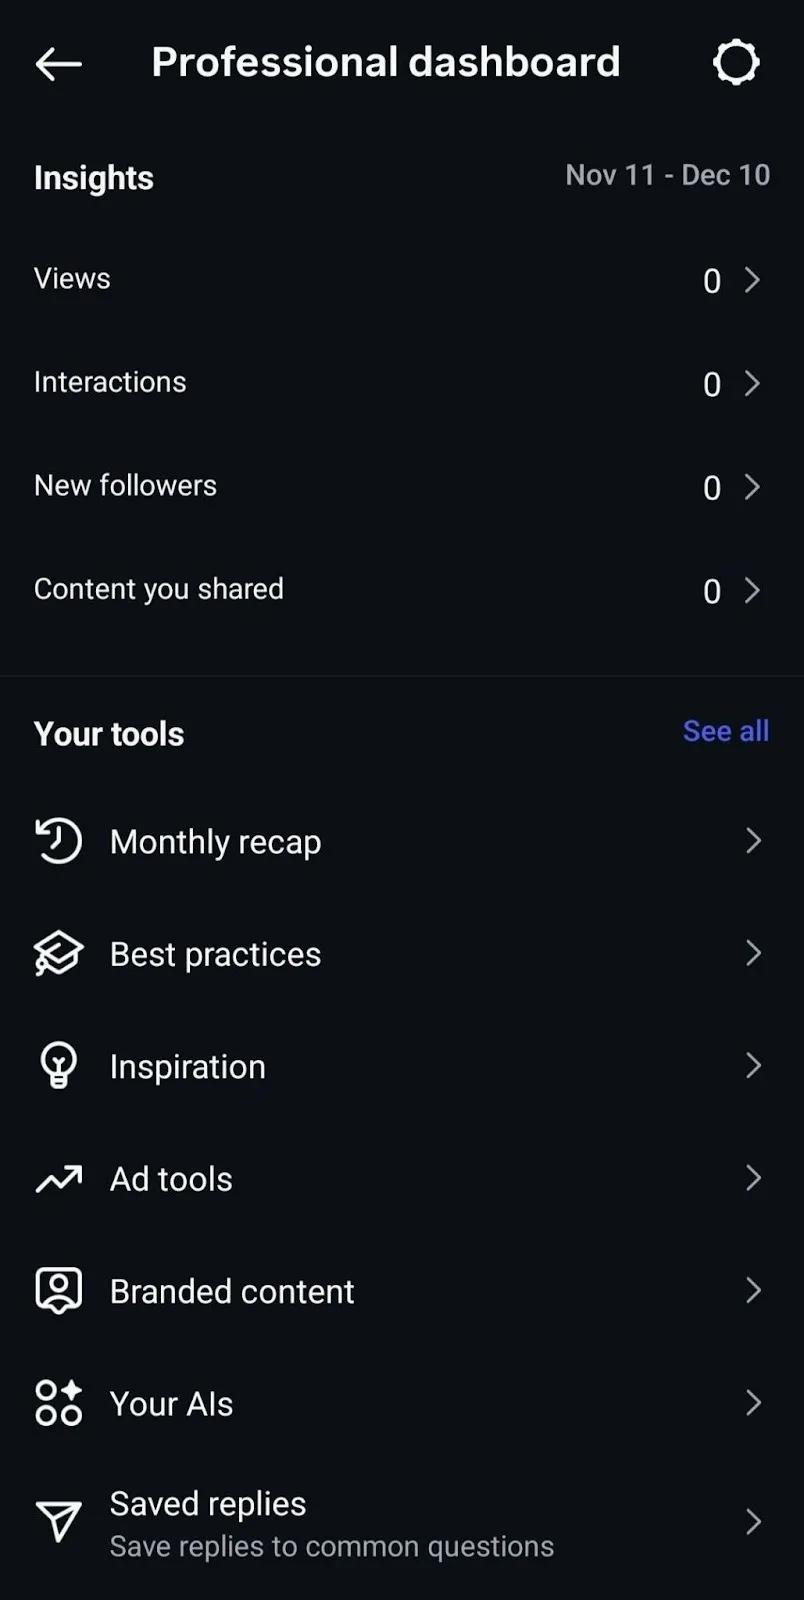
Then your Insights data should be on the top of the next page.
For PC:
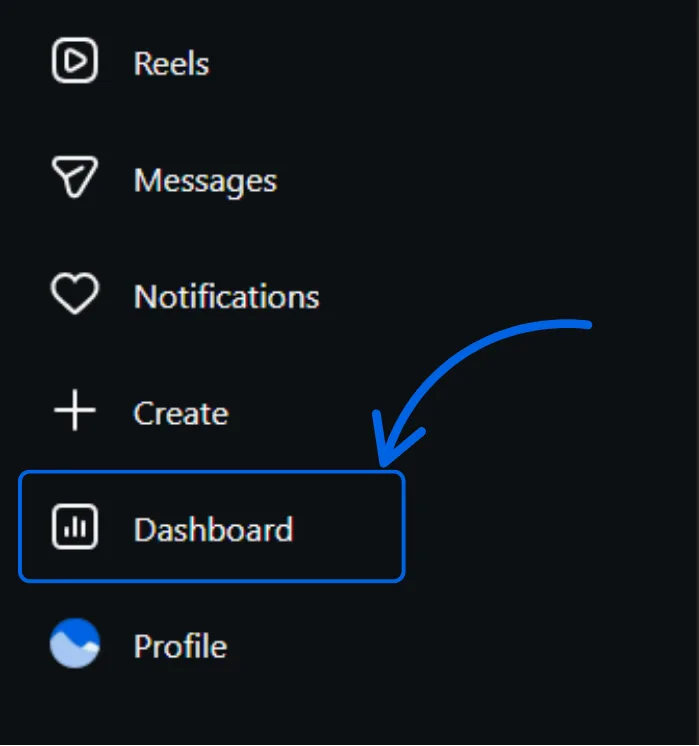
Head to Instagram.com, then click on Dashboard from the left sidebar.
Under Insights, choose the Account option.
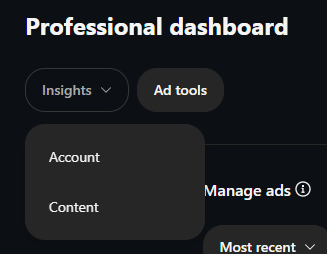
You’ll be then redirected to the Overview dashboard, where you can look at data like you see below.
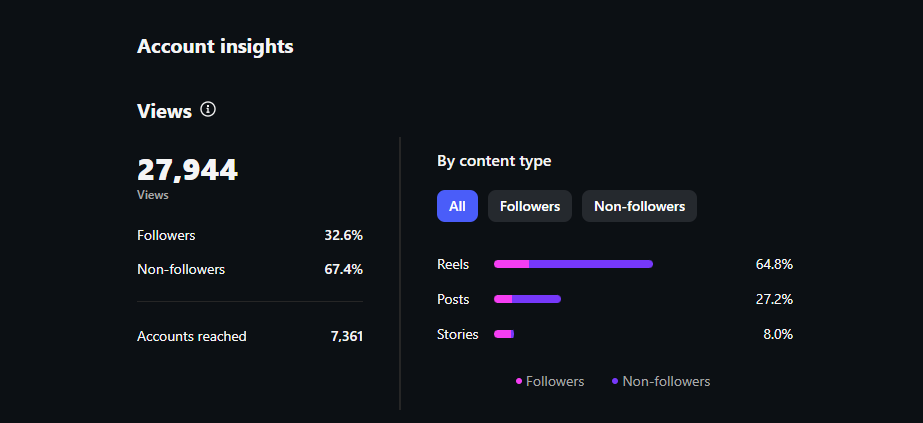
From here, you can explore different time periods and dig into specific content performance data.
The built-in insights work well for basic tracking. But they have some limits like Instagram only keeping your data for 60 days. The mobile-only access also makes it hard to create detailed reports.
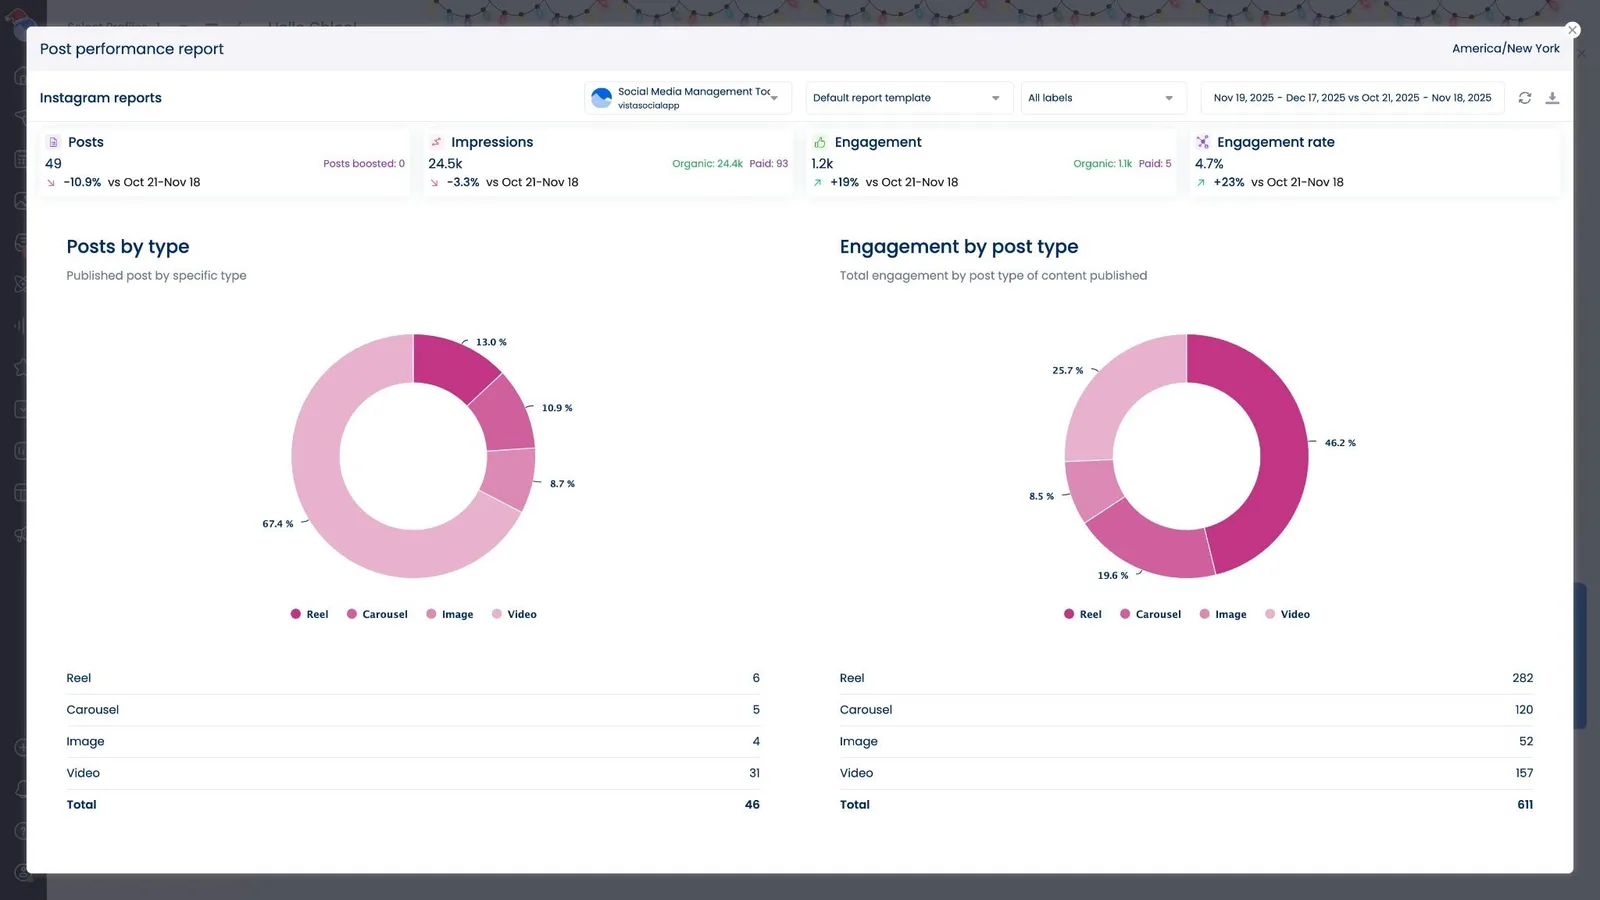
How to access Instagram analytics via Vista Social
Vista Social gives you more powerful Instagram analytics than the built-in tools. You can access your data from any device and keep historical records.
Here’s how to view your Instagram analytics in Vista Social:
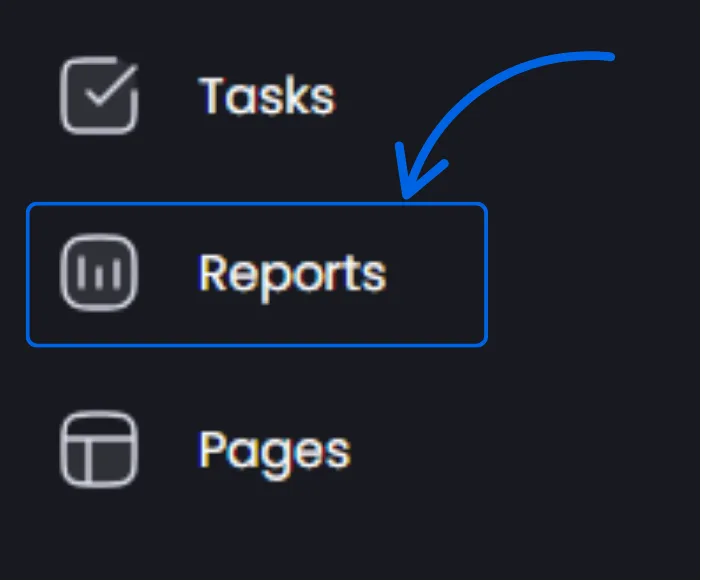
Log into your Vista Social dashboard and navigate to the Reports section in the left sidebar.
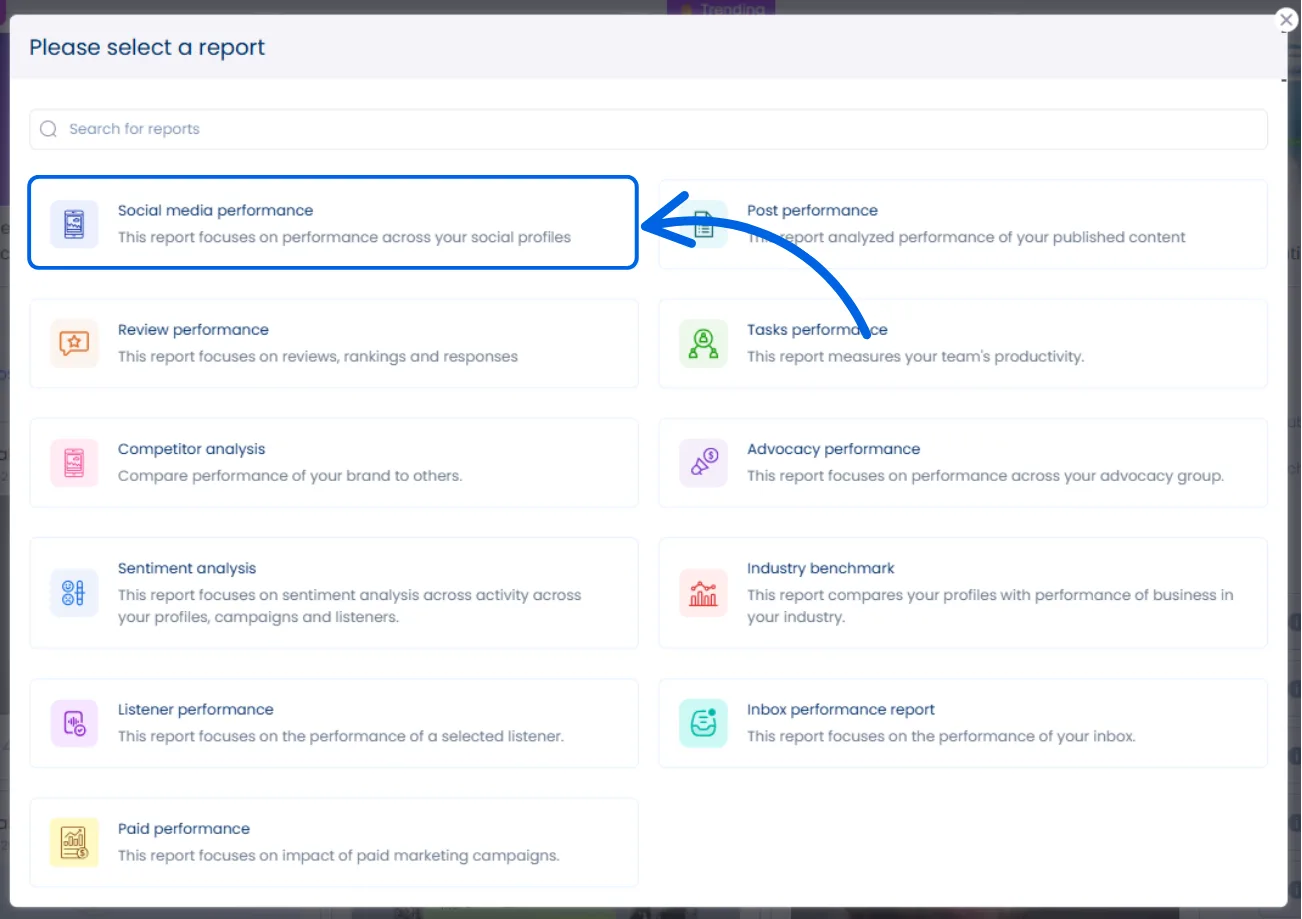
Select what type of report you want to run. In this instance, let’s run a Social media performance report.
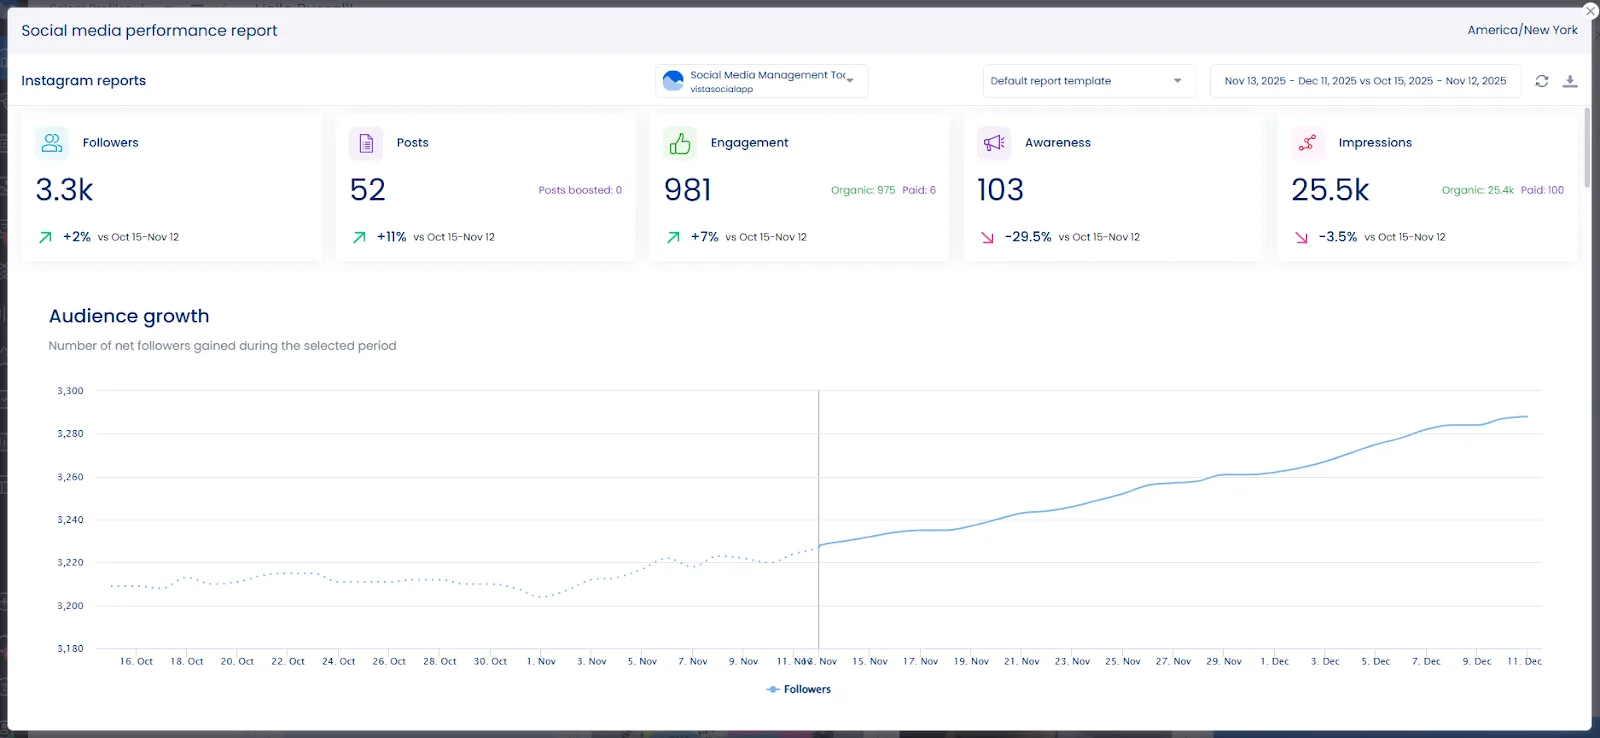
You should immediately see all of the data you’re looking for. You can also change the date if you’re looking for data from a different date range.
Vista Social’s Instagram analytics show deeper insights than the native tools:
- Cross-platform comparison: See how Instagram performs against other social channels
- Custom date ranges: Pull data from any time period you need
- Team collaboration: Share reports with colleagues and clients easily
- Automated reporting: Schedule regular analytics emails for stakeholders
The platform also tracks competitor performance and industry benchmarks. This context helps you understand if your results are good or if there’s room for improvement.
13 Instagram analytics metrics to track
Not all Instagram metrics are created equal. Some numbers look impressive but don’t actually help your business goals. Here are the 13 metrics that matter most for SMMs.
Total followers
Your follower count shows the size of your potential audience. But bigger isn’t always better when it comes to Instagram success.
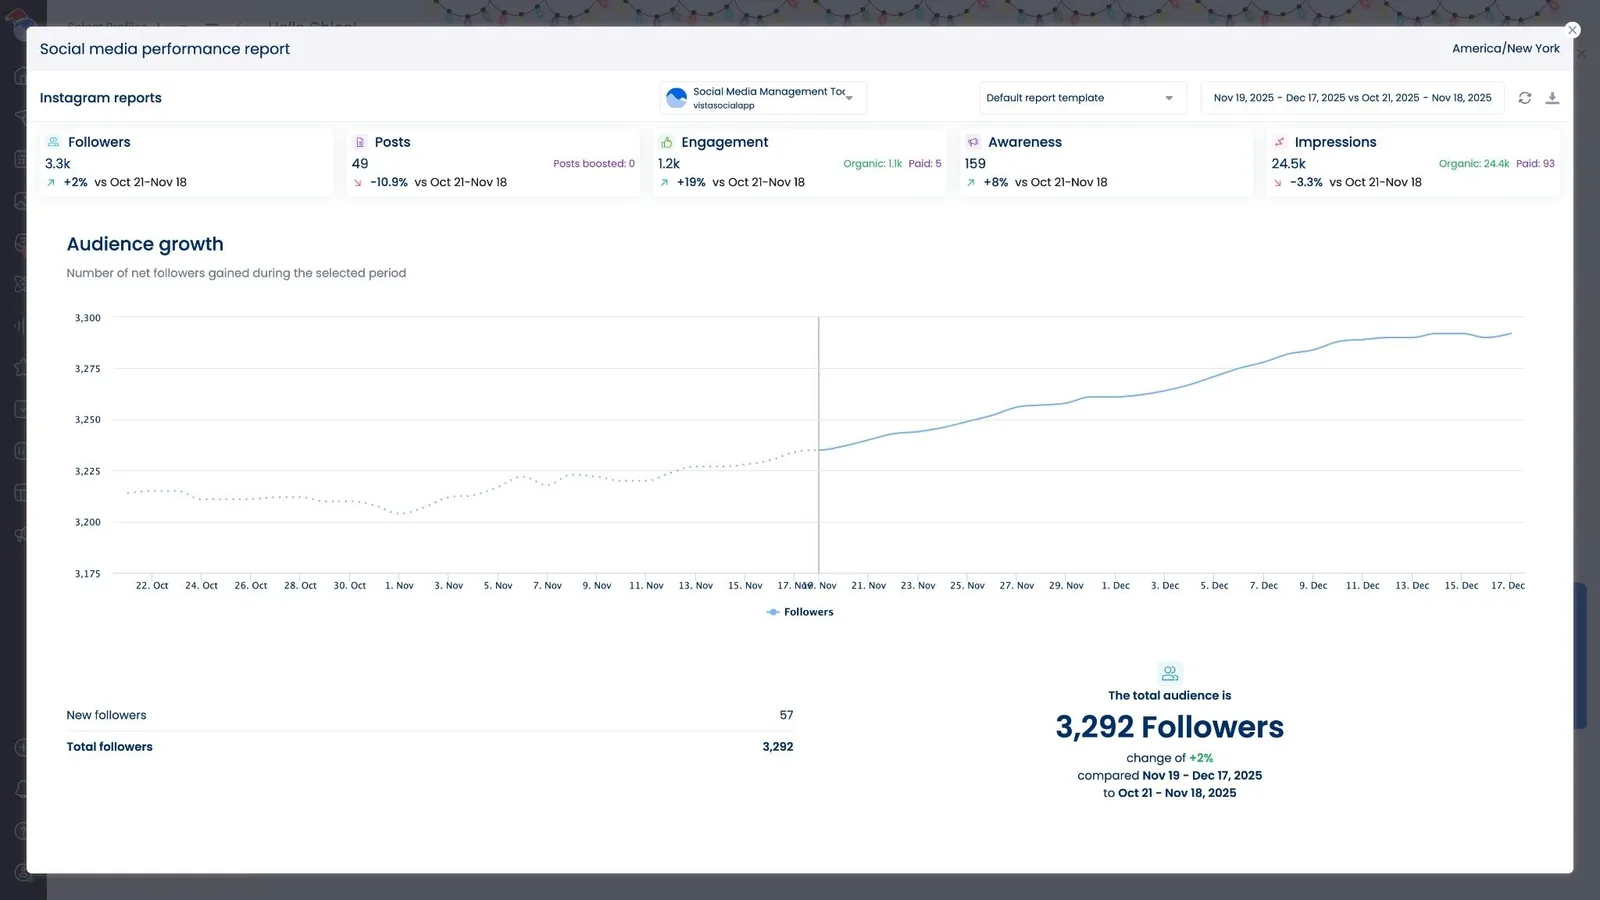
Quality followers matter more than quantity. A smaller audience of engaged users beats a large group of inactive accounts any day.
Track your follower count alongside other metrics like engagement rate. If you’re gaining followers but losing engagement, something’s wrong with your content strategy.
Follower growth
Follower growth rate shows how fast your audience is expanding. This metric reveals if your content strategy attracts new people to your brand.
Calculate your growth rate by dividing new followers by total followers. Then multiply by 100 to get a percentage. You can also see your percent change within your Vista Social report.
Healthy accounts typically see 1-3% monthly growth. Industry data shows that accounts posting consistently see better growth rates than sporadic posting. Faster growth might indicate viral content or successful campaigns. Slower growth suggests you need to adjust your strategy.
Profile views
Profile views show how many people visited your Instagram page. This metric indicates brand awareness and content discovery.
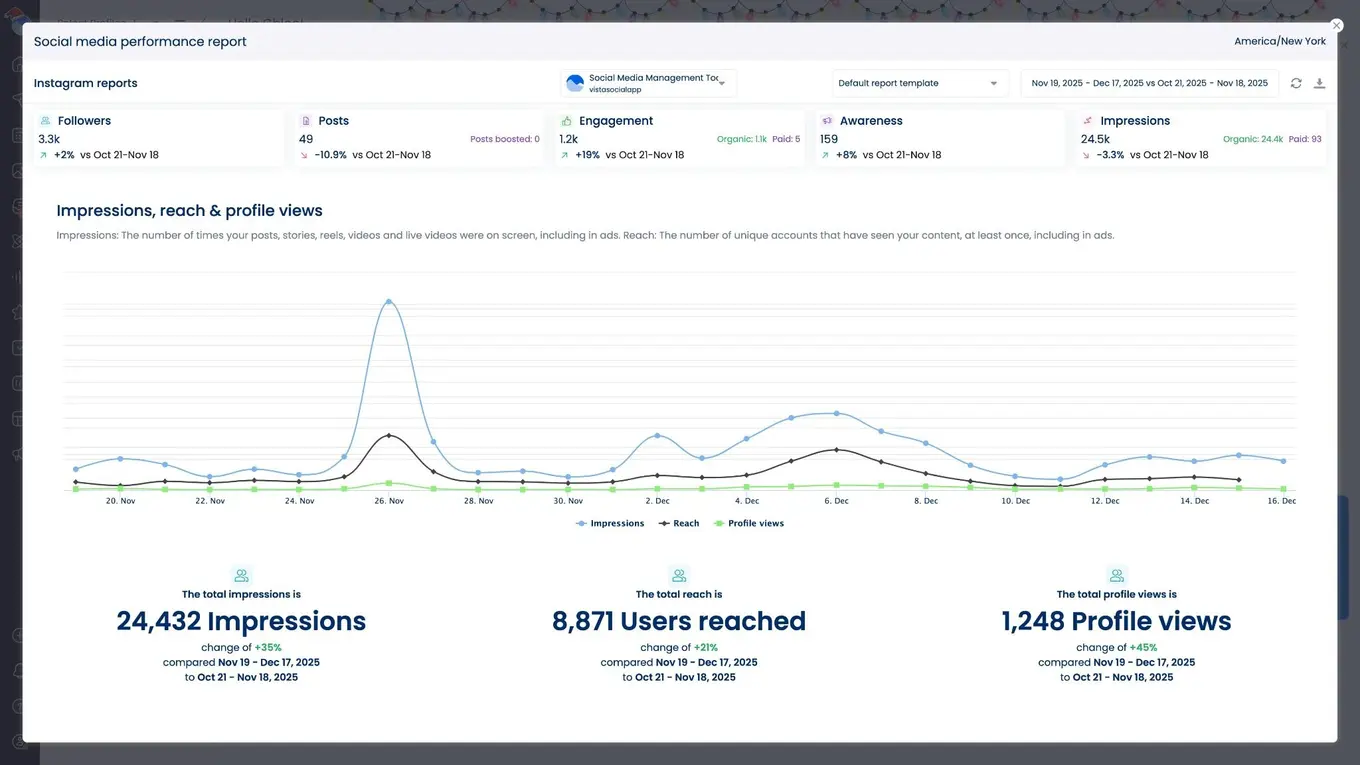
High profile views with low follower growth means people are interested but not convinced to follow. This suggests your bio or recent content needs improvement.
Track profile views alongside your content publishing schedule. Spikes often correlate with your best-performing posts or stories.
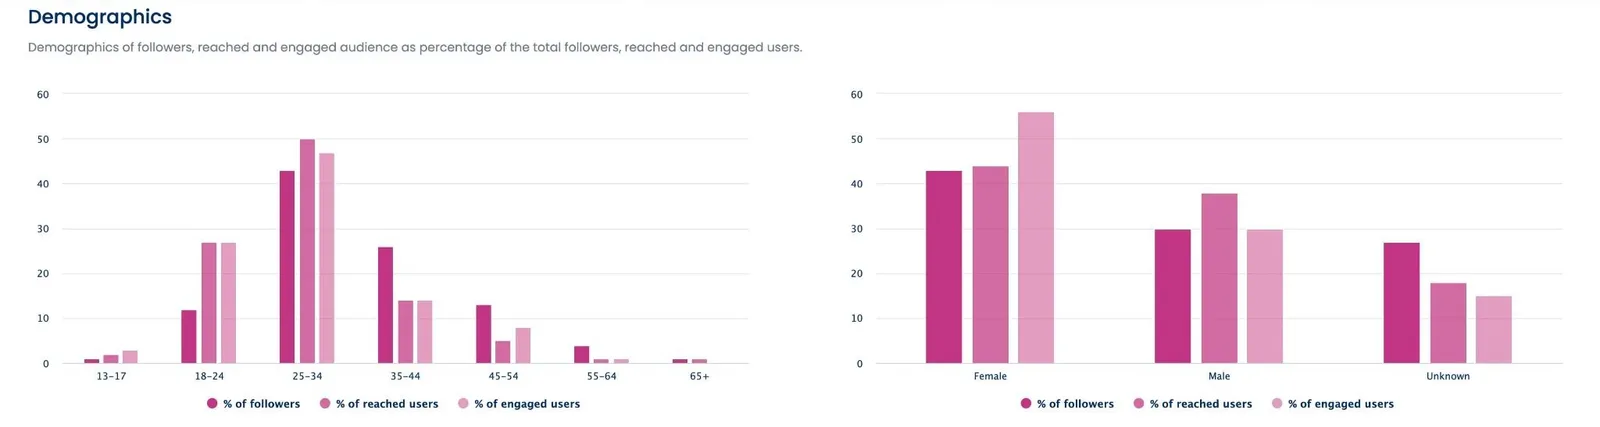
Audience insights
Audience insights reveal who follows your account. This demographic data helps you create content that resonates with real people.
Key audience metrics include:
- Age ranges: Which generation makes up most of your followers
- Gender split: How your audience breaks down by gender
- Location data: Where your followers live geographically
- Active times: When your audience uses Instagram most
Compare your actual audience to your target market. Big differences suggest your content attracts the wrong people. You might need to adjust your hashtags, content topics, or posting times.
Audience online activity
Knowing when your audience uses Instagram helps you time your posts perfectly. This data shows the hours and days when your followers are most active.
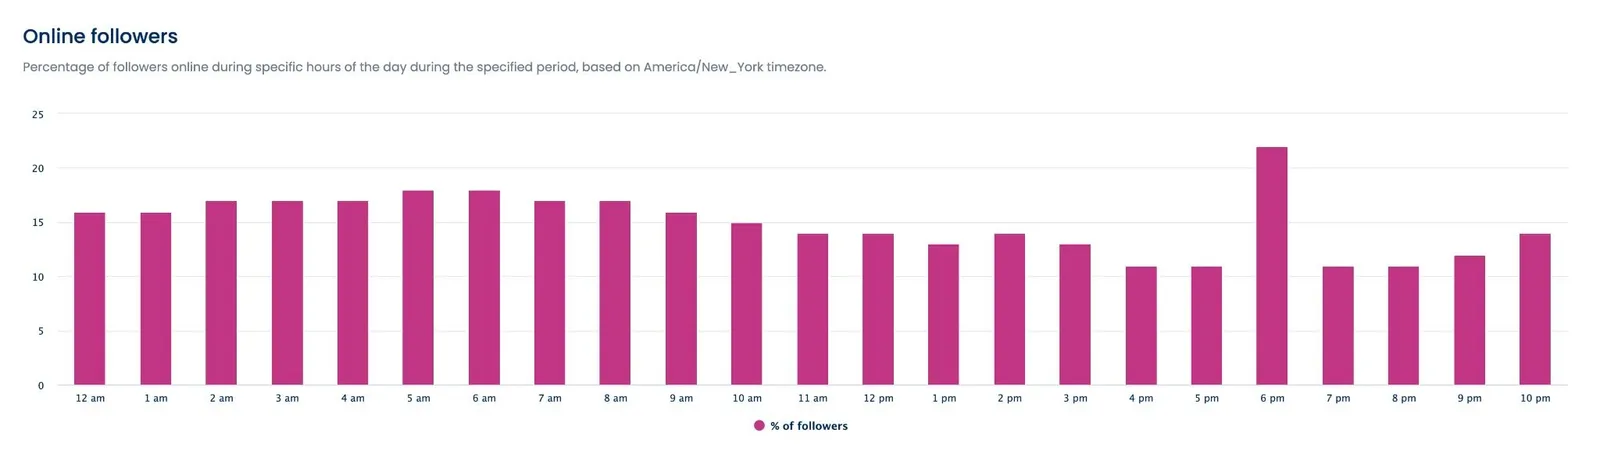
Post when your audience is online to maximize initial engagement. Early engagement signals to Instagram’s algorithm that your content is worth showing to more people.
Essential social media metrics include timing data because it directly impacts your organic reach.
Views
Views tell you how many times people saw your content. This metric applies to Instagram Reels, stories, and IGTV videos.
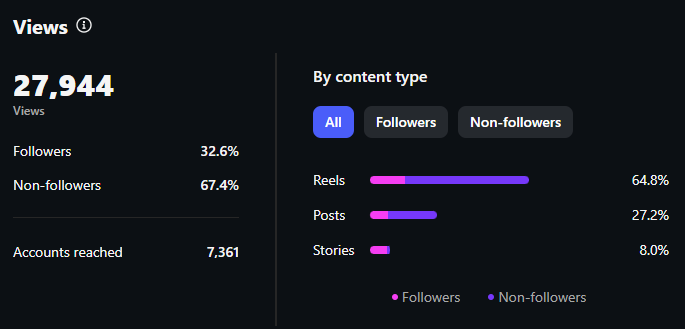
Views don’t equal engagement, but they show your content’s discovery potential. High views with low engagement suggest your content attracts attention but doesn’t hold interest.
Compare views across different content formats. You might find that Reels get more views but carousel posts drive more meaningful engagement.
Interactions
Interactions include likes, comments, shares, and saves on your posts. This metric shows how engaging your audience finds your content.
Calculate your engagement rate by dividing total interactions by follower count. Multiply by 100 for a percentage. Vista Social does this for you in your Post Performance Report.
Good engagement rates vary by industry, but 1-3% is typical for most brands. However, engagement rates have declined significantly in 2025, with current rates being less than half of what they were a year ago. Higher rates indicate strong content that resonates with your audience.
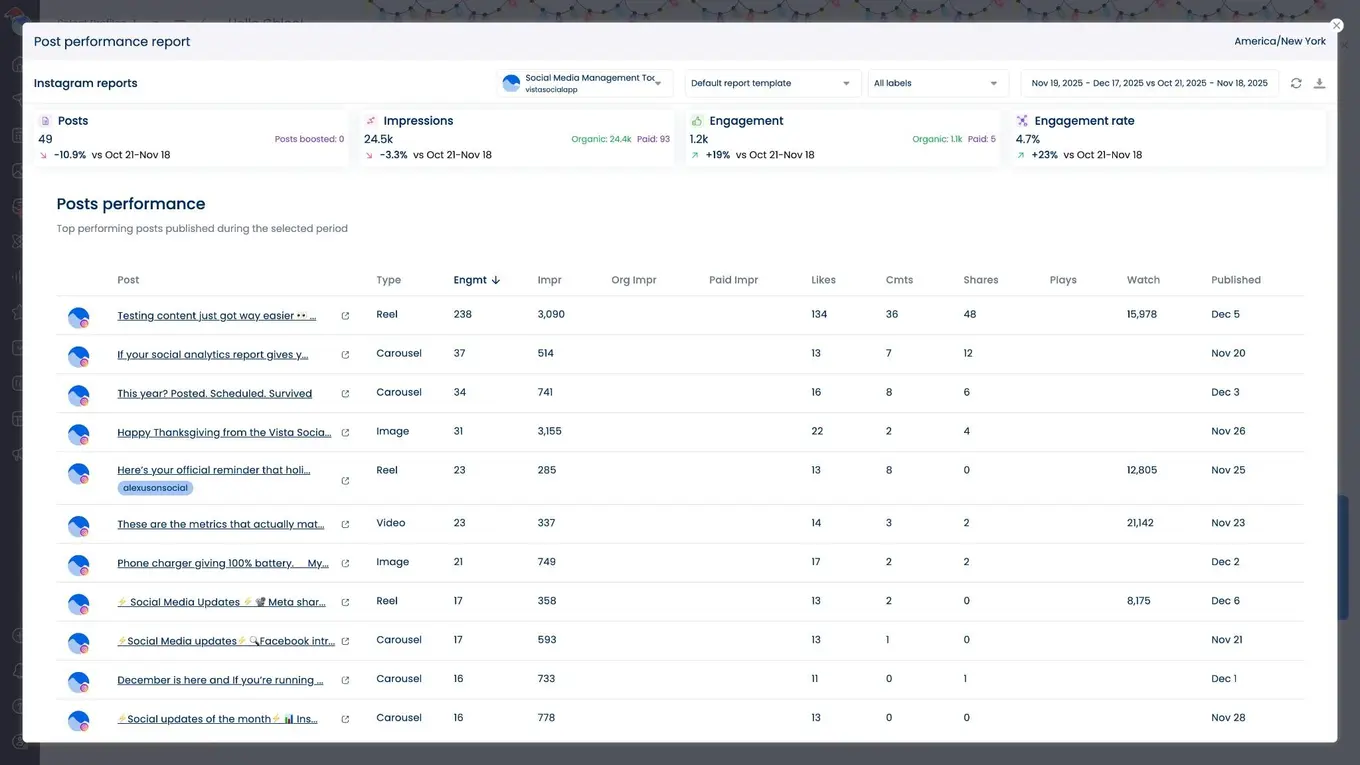
Plays
Plays show how many people watched your video content. This metric applies to Reels, IGTV videos, and video posts.
Track plays alongside watch time to understand video performance fully. High plays with low watch time means your content hooks viewers but doesn’t keep their attention.
Watch time
Watch time shows how long people spend viewing your video content. This metric reveals if your videos hold audience attention.
Instagram’s algorithm favors videos with high watch time. Longer viewing sessions signal that your content provides value.
Aim for watch times above 50% of your video length. Lower percentages suggest your content needs stronger openings or more engaging storylines.
Top content type
This metric shows which content format performs best for your account. Options include single photos, carousel posts, Reels, and stories.
Use this data to guide your content planning. If carousel posts consistently outperform single photos, create more multi-slide content.
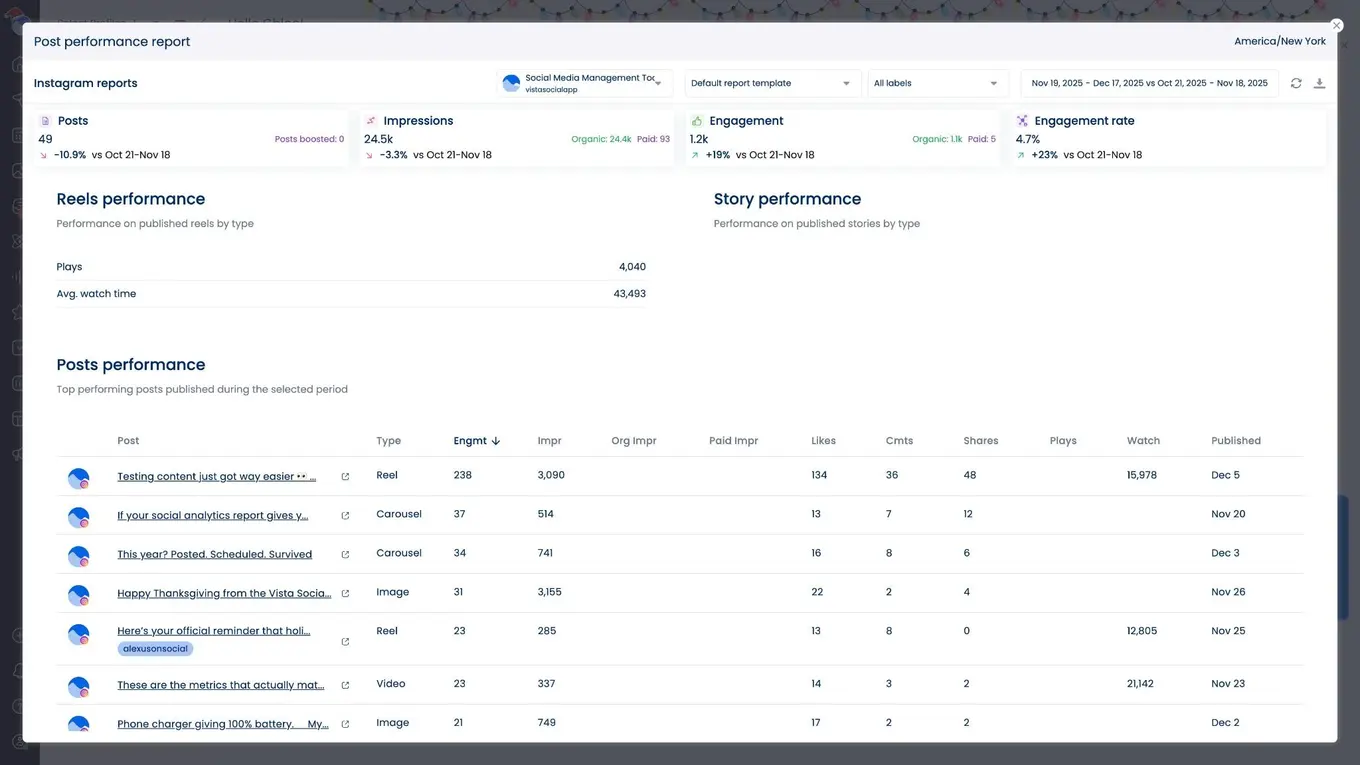
Top posts
Your top-performing posts reveal what content resonates most with your audience. Use this data to identify successful content themes and formats.
Brand awareness score
Brand awareness score measures how well your content increases recognition for your brand. This metric combines mentions and shares across the platform.
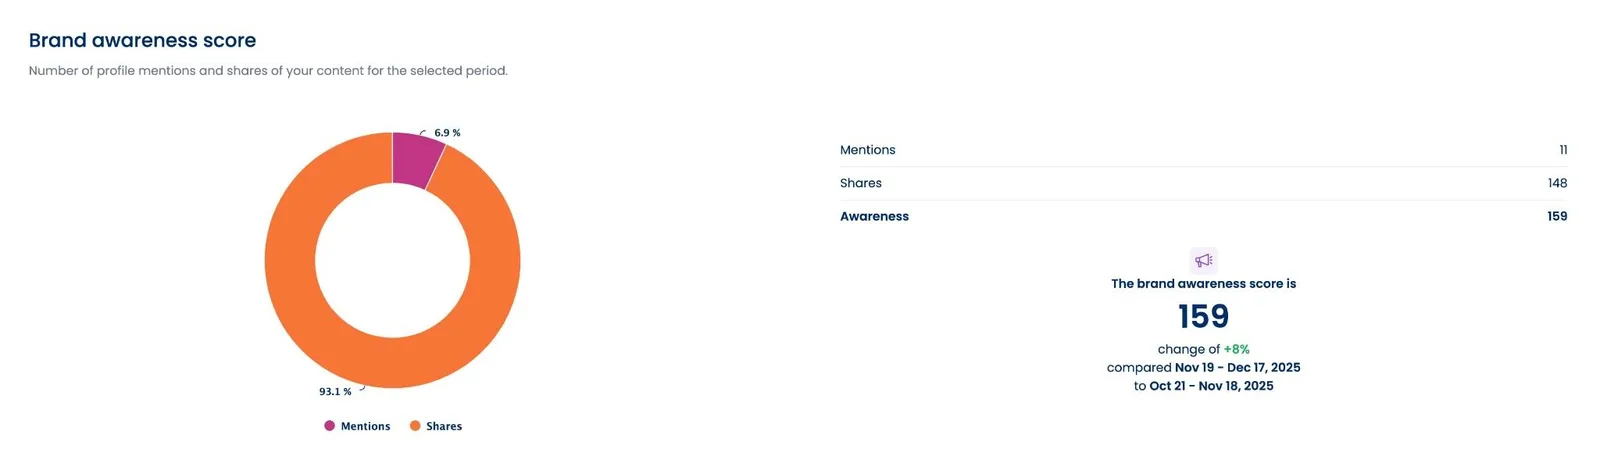
Higher brand awareness scores indicate your Instagram strategy successfully builds recognition. Track this metric monthly to see long-term progress.
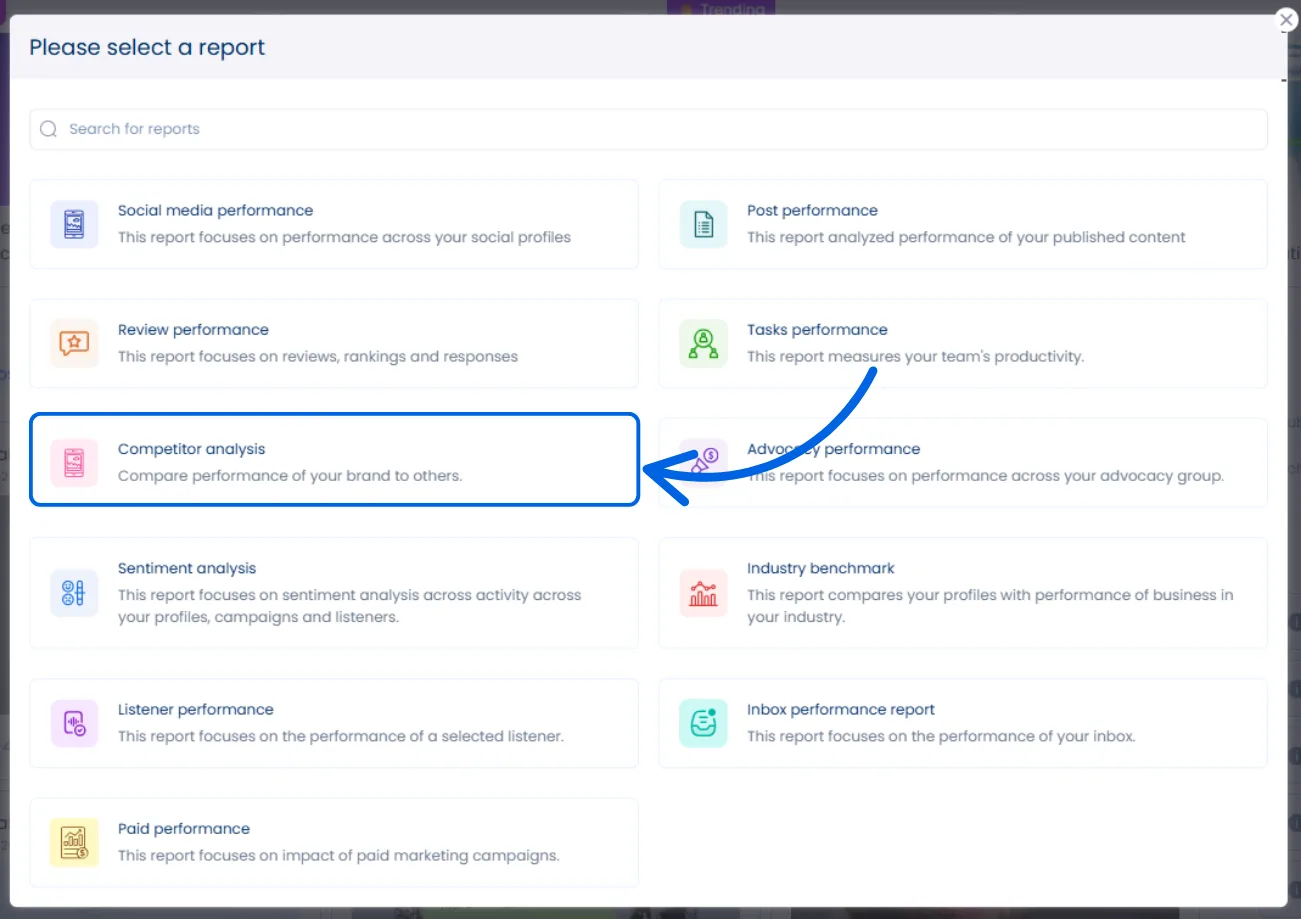
Competitor comparison
Comparing your performance to competitors reveals industry benchmarks and opportunities. This analysis shows where you lead and where you lag behind.
You can run a report via the Competitor Analysis option.
Key comparison points include:
- Engagement rates: How your audience interaction compares
- Posting frequency: Whether you post more or less than competitors
- Content types: Which formats competitors use most successfully
- Follower growth: How fast you’re growing relative to others
Don’t copy competitors exactly, but learn from their successful strategies. Instagram analytics tools make competitor tracking much easier than manual research.
How Instagram analytics can give you important business insights
Raw numbers tell you what happened. Smart analysis tells you why it happened and what to do next. Here’s how to extract business insights from your Instagram data.
Find your audience’s most online moments
Your posting schedule should match when your audience uses Instagram. Analytics reveal the exact hours and days when your followers are most active.
The best way to check this is when you’re scheduling content, click on the Show optimal times option.
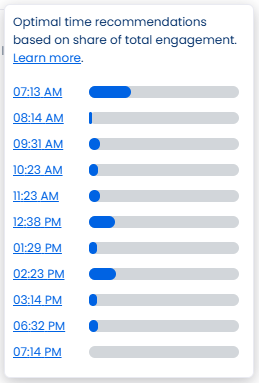
Vista Social automatically takes note of when your audience is online and what time is best to post your content.
Don’t assume your audience follows typical social media patterns. Different industries and demographics have unique Instagram habits. B2B audiences might be most active during mornings and lunch breaks, while B2C brands often see peaks during commute times and weekends.
Test posting at different times and track the results. Your optimal schedule might surprise you. Instagram business strategies always include timing optimization.
Look for patterns in your top content
Your best-performing posts contain clues about what your audience wants to see. Analyze these posts to find repeatable success patterns.
Common patterns to look for:
- Visual styles: Do bright colors outperform muted tones?
- Caption length: Do longer captions get more engagement?
- Post topics: Which subjects generate the most comments?
- Call-to-action types: What prompts drive the most action?
Document these patterns in a content guide for your team. Clear guidelines help maintain consistency across all your Instagram content.
Measure growth alongside your goals
Instagram metrics should connect to business objectives. Follower growth means nothing if it doesn’t support your company’s goals.
Align your Instagram metrics with business outcomes:
- Brand awareness goals: Track reach, impressions, and brand mention volume
- Lead generation: Monitor profile clicks, website visits, and contact form submissions
- Sales objectives: Follow link clicks, product tags, and conversion tracking
- Customer service: Watch comment response times and sentiment scores
Regular social media reporting helps you prove Instagram’s business value to stakeholders.
Make sure your follower demographics align with your target audience
Your ideal customer and your actual followers should match closely. Demographics misalignment wastes your marketing efforts.
Compare your follower data to your target audience:
- Age groups: Are you reaching the right generation?
- Geographic location: Do followers live where you sell products?
- Gender breakdown: Does this match your target market?
- Interest categories: Are followers interested in your industry?
Big differences indicate your content strategy needs adjustment. You might be using the wrong hashtags or creating content that appeals to the wrong people.
Use your Instagram analytics to grow your presence
Instagram analytics transform guesswork into strategy. The data shows exactly what works for your brand and audience.
Smart SMMs use these insights to create better content, post at optimal times, and reach the right people. Your analytics reveal opportunities that competitors might miss.
Vista Social’s comprehensive analytics platform makes this process simple and efficient. You get historical data tracking and cross-platform performance comparison that Instagram’s native tools can’t provide.
Start by focusing on the 13 key metrics we covered. Track them consistently and look for patterns over time. Use these insights to guide your content strategy and posting schedule.
Ready to unlock the full potential of your Instagram data? Explore Vista Social’s comprehensive analytics platform and see how deeper insights can transform your social media results.
Instagram analytics FAQs
What are Instagram analytics?
Instagram analytics are data points that show how your content and account perform on the platform. These metrics include follower growth, engagement rates, reach, impressions, and audience demographics.
Analytics help you understand what content works best, when your audience is most active, and how your Instagram strategy supports business goals.
Do you need a professional Instagram account to view analytics?
Yes, you need either a business or creator account to access Instagram’s built-in analytics. Personal accounts don’t have access to insights or analytics features.
Converting to a business account is free and gives you access to:
- Post and story performance data
- Audience demographic information
- Profile visit tracking
- Website click monitoring
You can switch account types in your Instagram settings without losing any content or followers.
How often should you check your Instagram analytics?
Most SMMs should review their Instagram analytics weekly for basic monitoring and monthly for deeper strategy analysis.
Weekly checks help you spot immediate trends and adjust your posting schedule if needed. Monthly reviews allow you to analyze bigger patterns and make strategic content decisions.
If you’re running paid campaigns or testing new strategies, daily monitoring might be necessary. Instagram marketing campaigns require closer attention during active periods.
Use automated reporting tools to stay informed without spending hours manually collecting data. Vista Social can send regular analytics summaries to keep you updated on performance trends.
Try Vista Social for free
A social media management platform that actually helps you grow with easy-to-use content planning, scheduling, engagement and analytics tools.
Get Started NowAbout the Author

Content Writer
Russell Tan is a content marketing specialist with over 7 years of experience creating content across gaming, healthcare, outdoor hospitality, and travel—because sticking to just one industry would’ve been boring. Outside of her current role as marketing specialist for Vista Social, Russell is busy plotting epic action-fantasy worlds, chasing adrenaline rushes (skydiving is next, maybe?), or racking up way too many hours in her favorite games.
Loading related tools...


Tools
PublishingAnalyticsEngagementIntegrations
FacebookInstagramLinkedInRedditSnapchatThreadsTikTokX (Twitter)YouTubeBlueskyVista Page (link-in-bio)All IntegrationsCopyright © 2026 Vista Social LLC. All Rights Reserved.