


Published on September 27, 2024
13 min to read
Essential Social Media Metrics to Track for Success in 2024

Summarize with AI


Table of contents
Summarize with AI

ChatGPT

Claude

Perplexity
Share

Vista Social

X (Twitter)


Are you unsure whether your social media strategy is driving real results? In 2024, tracking essential social media metrics is no longer optional—it’s vital for businesses.
As data-driven marketing continues to dominate, relying on guesswork or outdated practices could leave your brand behind. Without tracking key metrics like engagement, reach, and conversions, you miss out on valuable insights that can refine your content and boost performance.
Metrics are your roadmap to success; helping you understand audience behavior, improve engagement, and maximize the return on investment (ROI). By making informed, data-backed decisions, you can now track the essential social media metrics and thrive in the ever-competitive digital landscape.
Table of contents
What are Social Media Metrics?
Ever wondered how the social media wizards seem to know exactly what their audience wants? Enter the essential social media metrics – the secret sauce of digital marketing success!
Social media metrics are the backbone of understanding your online presence. They offer key insights into how well your content resonates with your audience, helping you to assess and adjust your strategy for better results. Tapping into these metrics can let you discover what really engages your followers and what pushes them to take action.
Tracking these metrics provides a clear picture of your audience’s behavior, enabling you to shape content that not only catches attention but also sparks interaction.
Key metrics include:
- Engagement: It’s more than just surface-level likes. This metric shows how your audience is interacting with your content through comments, shares, and saves, giving you a real sense of connection.
- Reach: Shows how many unique users have seen your content, helping you gauge the visibility of your posts.
- Conversion: Want to see how your social media efforts are translating into actions like sign-ups or purchases? This metric gives you a clear view of how well your content is driving results.
Remember, in the fast-paced world of social media, staying ahead of the curve isn’t just an option – it’s a necessity. And with the right metrics in your toolbox, you’ll be the one setting the trends, not just following them.
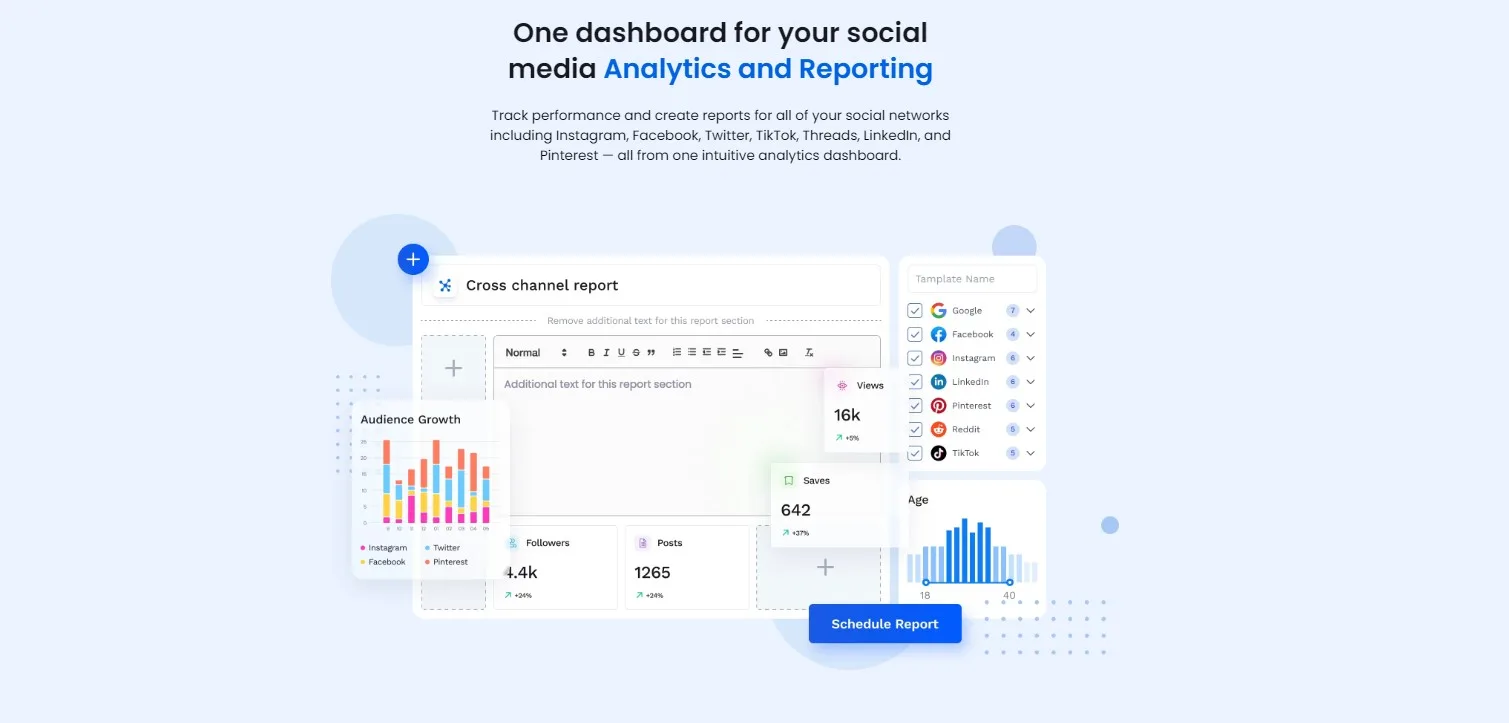
Vista Social revolutionizes your social media strategy by offering a powerful, all-in-one analytics dashboard. It seamlessly integrates data from major platforms, giving you a comprehensive view of your online performance.
Whether you’re tracking engagement, growth, or ROI, this tool simplifies the complex world of social media analytics, allowing you to make data-driven decisions and share insights effortlessly with your team.
Why is Measuring Social Media Engagement Metrics Important?
Measuring social media engagement metrics helps you assess and enhance your online performance. These metrics offer a clear picture of how your content resonates with your audience and determine the success of your social media strategy.
Audience Insight
Engagement metrics, such as likes, shares, and comments, reveal what content strikes a chord with your audience. Analyzing these interactions uncovers audience preferences, allowing you to tailor content that better suits their interests.
Optimization
Engagement metrics highlight which posts are successful and which are underperforming. This information enables marketers to adjust their strategies, increase engagement, and improve ROI. Focusing on top-performing content can significantly enhance social media effectiveness.
Brand Loyalty
High engagement levels reflect a loyal and connected audience. Followers who interact more with your content are often stronger brand advocates. Tracking these metrics helps foster deeper connections, building a loyal community that supports your brand long-term.
8 Social Media Metrics Marketers Are Prioritizing In 2024
Welcome to the digital jungle of 2024, where social media metrics are your compass, map, and secret weapon all rolled into one! Gone are the days of posting and praying – now, savvy marketers are diving headfirst into a treasure trove of data that’s more valuable than gold. These aren’t just cold, lifeless numbers; they’re the heartbeat of your online presence, whispering (and sometimes shouting) the secrets of what makes your audience tick.
Focusing on these vital metrics empowers you to truly connect with your audience, sparking engagement and driving meaningful results. So, buckle up, digital explorer – it’s time to decode these metrics and transform your social media game from meh to magnificent!
Social Media Engagement Metrics
Social media engagement metrics show how well your content connects with and influences your audience. These metrics provide important insights into how users interact with your posts, helping you see what works and what doesn’t in your social media strategy.
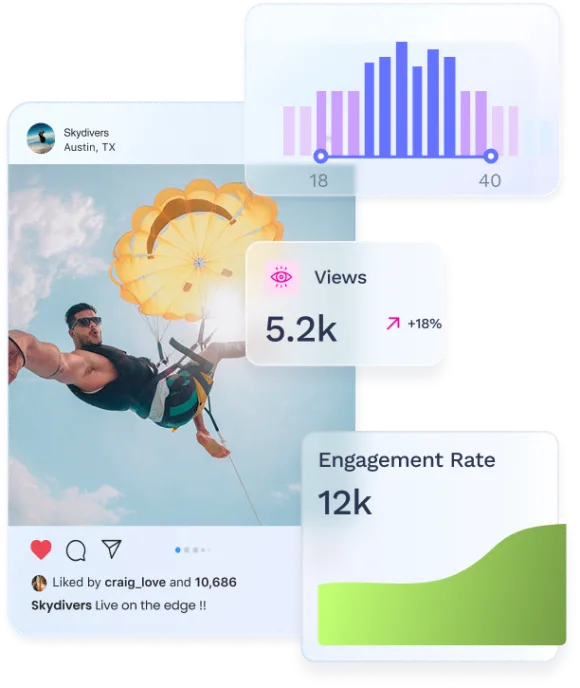
Engagement Rate
Engagement rate measures how effectively your content drives user interaction compared to its reach. It is calculated by dividing the total number of interactions—like likes, comments, and shares—by the total number of impressions or reach.
This metric offers a clear view of how well your content captures and retains your audience’s attention. A high engagement rate indicates that your content resonates with viewers, encouraging them to interact in meaningful ways.
It reflects the appeal of your content and its alignment with your audience’s interests and needs.
Likes, Comments, Shares
These fundamental engagement metrics serve as essential indicators of how your content is received and valued by your audience.
- Likes: This simplest form of engagement provides a quick view of approval. When users like your posts, it indicates that they find your content appealing or enjoyable. While likes alone may not deliver detailed feedback, they effectively signal initial interest and help you identify which posts resonate most with your audience.
- Comments: This metric offers a deeper look into audience sentiment, providing valuable feedback directly from your followers. It allows users to express their thoughts, opinions, and reactions to your content, giving you insights into their feelings and preferences. Engaging with comments not only helps build relationships with your audience but also fosters community interaction and dialogue. Monitoring and responding to comments creates a more engaged and loyal following.
- Shares: A powerful indicator of your content’s value to your audience. When users share your posts, they endorse your content and expand its reach to their networks. This metric reflects a high level of engagement and approval, showing that users are willing to promote your content to others. Understanding shares helps you grasp the broader impact of your content and its potential to drive conversations and enhance brand visibility.
[Must Read: Ultimate Guide: How to Calculate Your Social Media Engagement Rate]
Metrics for Audience Growth
Metrics for audience growth are essential for tracking the expansion of your social media following and understanding how effectively you are building your audience.
These metrics help you gauge the success of your strategies in attracting new followers and retaining existing ones, offering insight into the overall health and potential of your social media presence.
Follower Growth Rate
The follower growth rate measures how quickly your follower base is expanding over a specific period. It’s calculated by taking the difference in your follower count at two different times and dividing it by the initial follower count, then multiplying by 100 to get a percentage.
This figure gives you a clear understanding of how rapidly you are gaining new followers and highlights the effectiveness of your content and promotional strategies. A higher growth rate indicates that your audience finds your content valuable and engaging, encouraging new users to follow your profile.
Tracking changes in the growth rate over time allows you to assess the impact of various tactics and refine your approach to continue expanding your reach.
Follower Count
Follower count indicates the total number of users who follow your social media profile. This metric serves as a fundamental measure of your social media influence and audience size. While it doesn’t directly reflect engagement or content effectiveness, a higher follower count generally suggests a wider reach and a larger potential audience for your content.
Keeping track of changes in follower count helps you gauge the overall direction of your social media presence and evaluate how well your audience-building strategies are working. Analyzing trends in follower count allows you to see the effects of your content, promotions, and interactions on attracting and retaining followers, providing valuable insights to enhance your growth strategy.
Reach or Brand Awareness Metrics
Reach or brand awareness metrics play a key role in revealing how effectively your content spreads and how well your brand connects with a wider audience. These metrics provide valuable insights into the visibility and impact of your content, helping you understand your brand’s standing in the bustling world of social media.
Impressions
Impressions track the total number of times your content appears on a user’s screen, regardless of whether it receives a click. This metric sheds light on how visible your posts are and the frequency with which they are shown.
High impression counts signal that your content is reaching a broad audience and is being displayed repeatedly. Analyzing impressions empowers you to assess the effectiveness of your content distribution, unveiling the potential exposure your brand is garnering and the overall impact of your social media campaigns.
Reach
Reach measures the number of unique users who see your content.
Unlike impressions, which count the total number of times content is displayed, reach focuses on the number of distinct individuals exposed to your content. This metric offers valuable insight into how far your content is spreading.
A higher reach indicates that more unique users are engaging with your posts, which is essential for building brand awareness and expanding your audience base. Keeping an eye on reach allows you to evaluate the effectiveness of your strategies in attracting new viewers and boosting brand visibility.
Social Share of Voice (SSoV)
Social share of voice measures the share of online conversations surrounding your brand compared to those about your competitors. This metric highlights your brand’s presence and influence within your industry.
SSoV is calculated by taking the volume of mentions of your brand and dividing it by the total volume of mentions in your category, then multiplying by 100 for a percentage. A higher SSoV shows that your brand is generating more conversation and visibility relative to competitors, enabling you to assess your prominence in social media discussions and identify opportunities to enhance your brand’s engagement and influence.
[Must Read: Reach vs Impressions: What’s the Difference]
Metrics for Customer Retention
Metrics for customer retention are key to understanding how effectively you nurture relationships with your audience and keep customers engaged and satisfied over time. These metrics offer valuable insights into customer loyalty, satisfaction, and the overall health of your brand’s relationships.
Net Promoter Score (NPS)
Net Promoter Score (NPS) measures customer loyalty and satisfaction by assessing how likely customers are to recommend your brand to others.
It is calculated through responses to the question, “On a scale of 0 to 10, how likely are you to recommend our company to a friend or colleague?” Respondents fall into three categories: Promoters (9-10), Passives (7-8), and Detractors (0-6). To determine your NPS, subtract the percentage of Detractors from the percentage of Promoters.
A high NPS reflects strong customer satisfaction and loyalty, while a low score signals areas for improvement. Monitoring NPS helps you understand customer sentiment and identify opportunities to enhance the overall customer experience.
Churn Rate
Churn rate measures the percentage of customers who stop engaging with your brand or unsubscribe from your services over a specific period.
This is calculated by dividing the number of lost customers by the total number of customers at the start of the period and multiplying by 100 for a percentage. To better understand this metric, various CRO tools provide insights into user behavior on your website.
A high churn rate suggests that a significant portion of your customer base is leaving, which may indicate dissatisfaction or enticing offers from competitors.
Tracking churn rate allows you to spot patterns and potential issues that could impact customer retention, enabling you to implement strategies aimed at boosting satisfaction and reducing attrition.
Reviews
Reviews provide direct insights into customer experiences and satisfaction with your brand, offering valuable feedback about the quality of your products or services. Positive reviews enhance your brand’s reputation and attract new customers, while negative reviews reveal areas where improvement is necessary.
Monitoring and analyzing reviews helps you grasp customer perceptions and address concerns raised by your audience. Engaging with both positive and negative reviews shows your commitment to customer satisfaction, fostering trust and loyalty in your brand.
Conversion Metrics
Conversion metrics are essential for evaluating how effectively your social media efforts drive specific actions and achieve your business objectives. These metrics offer insights into how well your content and campaigns translate into tangible results, such as sales or sign-ups, helping you understand the overall impact of your social media strategy on your business goals.
Conversion Rate
Conversion rate measures the percentage of users who complete a desired action, such as making a purchase or signing up for a newsletter, relative to the total number of visitors or interactions.
This is calculated by dividing the number of conversions by the total number of visitors and multiplying by 100 for a percentage. A high conversion rate indicates that your social media campaigns and content effectively persuade users to take action.
This metric helps evaluate the effectiveness of your calls to action, landing pages, and overall user experience. Monitoring conversion rates allows you to pinpoint which strategies drive results, enabling you to optimize your approach for better performance.
Conversions
Conversions refer to the specific actions users take after engaging with your social media content. These actions might include completing a purchase, signing up for an event, or downloading an app—any goal relevant to your business objectives.
Tracking conversions offers a direct measure of how well your social media efforts achieve desired outcomes. This metric helps you assess the effectiveness of different campaigns, content types, and promotional tactics in influencing user behavior.
Analyzing conversion data empowers you to make informed decisions about resource allocation and refine your social media strategy to better align with your goals.
Social Media Referral Traffic
Social media referral traffic measures the number of visitors who reach your website or landing pages via social media platforms.
This metric sheds light on how effectively your social media content drives traffic to your site and provides insights into the quality and relevance of that content. Understanding this data can help you optimize your content strategy and identify which social media channels are most effective at generating traffic and conversions.
Metrics to Monitor Social Media Metrics
Monitoring customer service metrics is essential for ensuring that your interactions with customers are efficient, effective, and satisfactory. These metrics help you evaluate the quality of your customer support, identify areas for improvement, and enhance the overall customer experience.
Customer Satisfaction (CSAT) Score
Customer Satisfaction (CSAT) score measures how satisfied customers are with a specific interaction or overall service experience.
Typically gathered through surveys, customers rate their satisfaction on a scale (e.g., 1 to 5) after a support interaction. The CSAT score is calculated by averaging these ratings or dividing the number of satisfied customers (usually those who rated 4 or 5) by the total number of respondents and multiplying by 100 for a percentage. A high CSAT score indicates that customers are pleased with the service they received and that their needs were met effectively.
Response Time
Response time measures the average duration it takes for your customer service team to reply to customer inquiries or support requests.
Generally, shorter response times lead to higher customer satisfaction, as quick resolutions contribute to a positive customer experience. Monitoring response time helps identify any delays in your support process, allowing you to make necessary adjustments to improve efficiency. Analyzing response times ensures that your team effectively manages customer inquiries and provides timely assistance.
Total Response Volume
Total response volume measures the number of customer inquiries or support requests received within a specific period. This metric provides insights into the overall demand for your customer service and helps you understand the workload on your support team.
[Must Read: Social Media Sentiment Analysis: A Comprehensive Guide]
Paid Social Media Metrics
Paid social media metrics are essential for evaluating the effectiveness of your advertising campaigns and ensuring that your ad spend is generating the desired results. These metrics provide insights into the efficiency, profitability, and performance of your paid social media efforts, helping you optimize your strategy and achieve better outcomes.
Cost Per Click (CPC)
Cost Per Click (CPC) measures the amount you pay for each click on your social media ad. It is calculated by dividing the total cost of your ad campaign by the number of clicks it receives.
A lower CPC indicates that you are getting more clicks for your budget, while a higher CPC suggests that your ads might need optimization. Monitoring CPC helps you manage your advertising budget effectively and optimize your campaigns to achieve better results at a lower cost.
Return on Ad Spend (ROAS)
Return on Ad Spend (ROAS) measures the revenue generated for every dollar spent on advertising. It is calculated by dividing the total revenue generated from your ad campaigns by the total amount spent on those ads. ROAS is a crucial metric for evaluating the profitability of your advertising efforts and understanding how well your ads are driving revenue.
A higher ROAS indicates that your campaigns are generating a strong return on your investment, while a lower ROAS suggests that your ads may not be delivering the expected results.
Tracking ROAS helps you assess the financial effectiveness of your campaigns and make informed decisions about future ad spending.
Click-Through Rates (CTR)
Click-Through Rate (CTR) measures the percentage of users who click on your ad after seeing it. It is calculated by dividing the number of clicks by the number of impressions (the total number of times the ad was shown), then multiplying by 100 to get a percentage. A high CTR indicates that your ad is effectively capturing attention and encouraging users to take action, while a low CTR may suggest that your ad needs improvement.
Monitoring CTR helps you evaluate the effectiveness of your ad creatives, targeting, and overall campaign strategy.
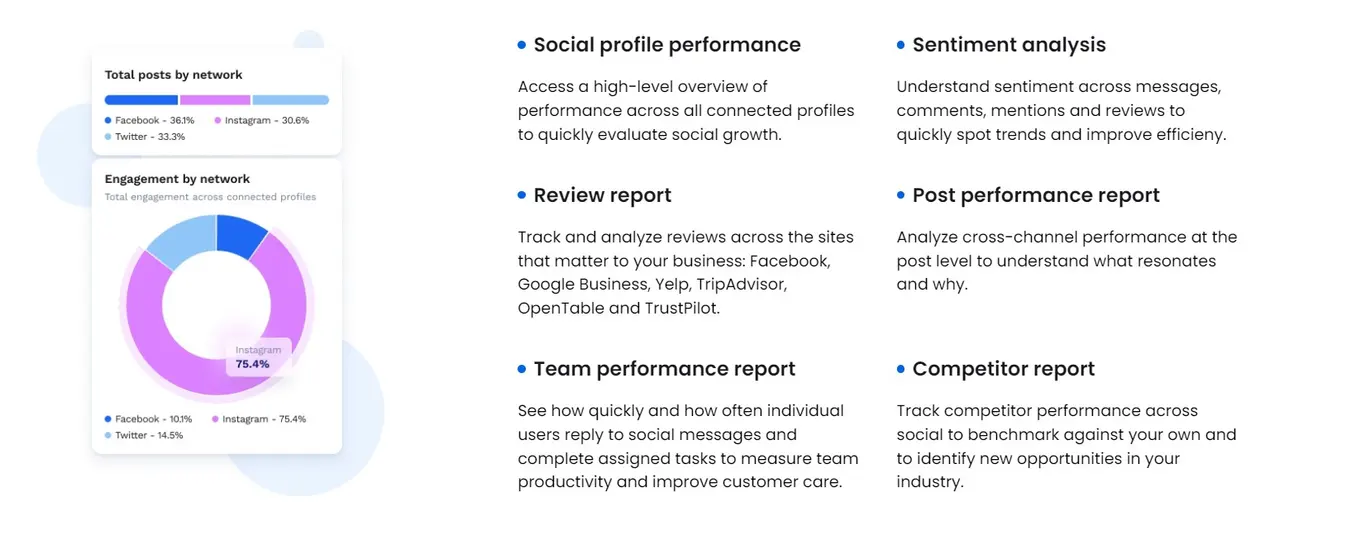
Vista Social can help you track all of the following from social profile performance to competitor reports. Tempted to use our features? Sign up now!
Track Your Success Now!
As we navigate the evolving landscape of social media in 2024, understanding and leveraging essential social media metrics is key to unlocking your strategy’s full potential. From engagement rates and follower growth to conversion metrics and paid ad performance, each metric provides valuable insights into how your content and campaigns are performing.
Tracking engagement metrics helps you gauge how well your content resonates with your audience, while metrics for audience growth reveal the effectiveness of your efforts in expanding your reach. Reach and brand awareness metrics shed light on how well your content is spreading, and customer retention metrics highlight the quality of your interactions with your audience. Paid social media metrics further guide you in optimizing your ad spend for maximum return on investment.
By focusing on these metrics, you can refine your strategies, enhance engagement, and drive meaningful results.
Embrace these insights to stay ahead of trends, make data-driven decisions, and ensure your social media efforts are not just effective but truly impactful.
P.S. Welcome! If you’re new to Vista Social, you’re in for a treat. We’re your all-in-one solution for managing social media. What sets us apart? We focus on delivering exceptional value, innovative features, and a design that puts you first. Our tools are crafted to boost teamwork, enhance productivity, and drive impactful results for your social media campaigns.
Create a Vista Social account today and experience the difference for yourself!
Frequently Asked Questions on Essential Social Media Metrics
What is the difference between reach and impressions?
Reach refers to the number of unique users who see your content, while impressions count the total number of times your content is displayed, regardless of whether it is clicked. Both metrics provide insights into your content’s visibility.
What is a good conversion rate for social media?
A good conversion rate varies by industry and specific goals, but generally, rates between 2% to 5% are considered average. Monitoring your own conversion rates over time is essential for evaluating performance.
How often should I review my social media metrics?
Regularly reviewing your essential social media metrics—ideally weekly or monthly—can help you stay informed about your performance, allowing you to make timely adjustments to your strategy.
What are some common mistakes to avoid when tracking social media metrics?
Common mistakes include focusing on vanity metrics (like follower count) instead of meaningful engagement metrics, failing to set clear goals, neglecting to analyze data consistently, and not adjusting strategies based on insights gained.
Try Vista Social for free
A social media management platform that actually helps you grow with easy-to-use content planning, scheduling, engagement and analytics tools.
Get Started NowAbout the Author

Content Writer
Content writer and copywriter with over 2 years of experience, specializing in VSL scriptwriting. I’ve worked with various brands to create compelling content. Passionate about storytelling that connects and converts. Loves cats, poetry, and skincare
Loading related tools...


Tools
PublishingAnalyticsEngagementIntegrations
FacebookInstagramLinkedInRedditSnapchatThreadsTikTokX (Twitter)YouTubeBlueskyVista Page (link-in-bio)All IntegrationsCopyright © 2026 Vista Social LLC. All Rights Reserved.