


Published on March 11, 2026
14 min to read
AI for Social Media Reporting: How to Turn Numbers Into Next Steps

Summarize with AI


Table of contents
Summarize with AI

ChatGPT

Claude

Perplexity
Share

Vista Social

X (Twitter)


It’s reporting time again.
The same old process of opening five (or fifty) browser tabs, pulling numbers from twelve different places across seven different platforms, pasting them into a slide deck or spreadsheet, and spending the next however many hours writing commentary all for your client or stakeholder to skim for 30 seconds before asking, “but what does it mean?!”
The data itself has never been the problem. Most social media managers have more numbers than they know what to do with.
The actual problem is the distance between those numbers and a clear story someone can act on—and how long it takes to close that distance every single month.
AI social media reporting changes that workflow at the source. Our guide covers what this actually looks like in practice, why the teams adopting it are moving faster than those who haven’t, and how to set it up without adding more complexity to an already full plate.
Table of contents
What is AI social media reporting?
AI social media reporting uses machine learning, natural language processing, and pattern recognition to collect, analyze, and summarize social media performance data automatically.
The goal is to get from raw metrics that don’t immediately tell the story to something a decision-maker can actually use, without requiring a full day of manual work to get there.
The clearest way to see the difference is to compare the two approaches side by side.
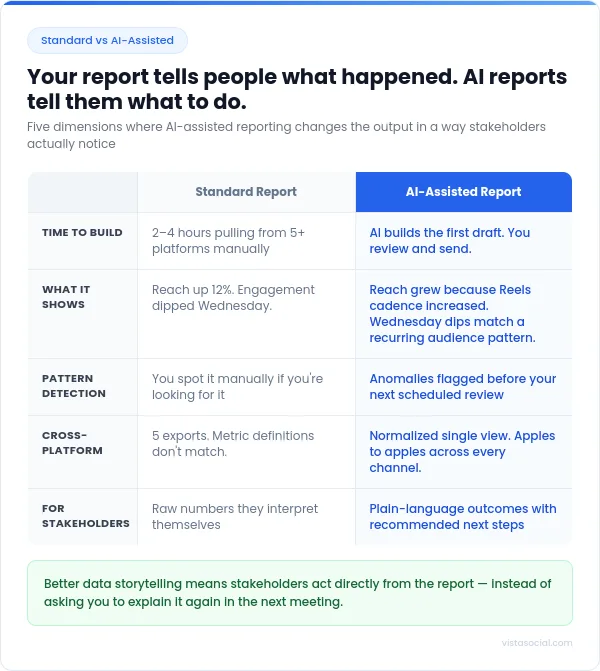
A standard report tells you:
- Reach was up 12%
- Engagement dipped on Wednesday
An AI-assisted report tells you:
- Reach grew because your Reels cadence increased
- Wednesday dips match your audience’s consistent behavior pattern
- The post that outperformed everything else did so because it was published in the 90-minute window when your specific audience is most active
One describes what happened, but gives you nothing else.
The other explains it and tells you what to do next. That shift from descriptive to prescriptive is what makes AI reporting genuinely useful.
For a deeper look at how social analytics fits into a broader strategy, our guide to social media analytics and intelligence is worth reading alongside this one.
Why social media managers are turning to AI for reporting
The reasons aren’t complicated. Reporting has always been time-consuming, and the expectations placed on what a report should do have grown significantly without a corresponding increase in how much time anyone has to build it.
Here’s what’s actually driving the shift.
Manual reporting is a time drain
Pulling data from multiple platforms by hand is a fragmented process by design. Each platform has its own export format, its own definitions for metrics (like reach versus views, or watch time versus play time), and its own quirks around what it surfaces and when.
A social media manager running accounts across Instagram, LinkedIn, TikTok, Facebook, and YouTube is doing five separate data jobs every month and then trying to make them tell one coherent story.
AI consolidates that, and instead of toggling between dashboards and reformatting exports, you get normalized cross-platform data in one place, with the patterns surfaced automatically. The time that was going toward aggregation comes back for analysis, which is the part of reporting that actually requires your judgment.
Stakeholders want insights, not spreadsheets
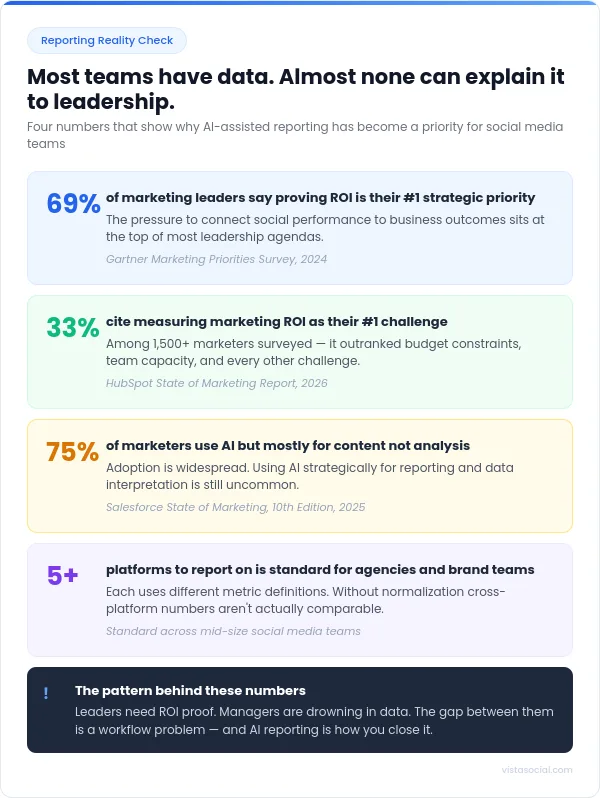
According to a Gartner survey of marketing leaders, 69% of respondents say that demonstrating ROI was the most commonly selected strategic priority. That number reflects something most social media managers already know from experience: The pressure to connect social performance to business outcomes isn’t easing up.
The challenge is that most social metrics don’t translate naturally into business language. Your leadership doesn’t particularly care that the engagement rate went from 2.1% to 2.6%—that doesn’t mean anything to them.
What they do want to know is if social is contributing to the pipeline, what it’s doing for brand perception, and whether you’re winning or losing ground against competitors.
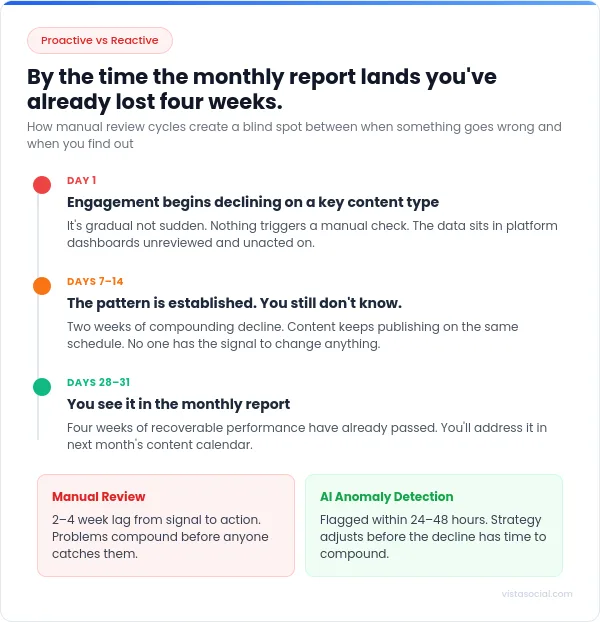
By the time you notice a problem, you’ve already lost time
A social media manager reviewing numbers on a weekly or monthly basis is always looking backwards. If engagement has been quietly drifting for three weeks, you find out about it three weeks too late.
AI flags anomalies as they happen. A 15% engagement drop on a specific content type, a reach spike in an audience segment you hadn’t been targeting, and an uptick in negative sentiment after a campaign goes live—all of it surfaces before your next reporting cycle.
Proactive monitoring, where you’re getting ahead of shifts rather than explaining them after the fact, is one of the most practical ways AI changes how reporting works day to day.
Multi-platform reporting is a mess
Running social across five or more platforms is standard for agencies and most mid-size brand teams. Each of those platforms defines its metrics differently.
A LinkedIn “impression” is not the same thing as a TikTok “view,” and comparing click-through rates across Facebook and Pinterest without normalizing for how each platform counts them produces numbers that don’t mean anything.
AI reporting tools standardize the data before it reaches you. The result is a cross-platform view where the numbers are actually comparable, which makes it possible to say something meaningful about where your effort is generating returns and where it isn’t.
If you’re also managing client reporting for multiple accounts, that normalization becomes even more valuable. Clients don’t want to hear about platform-specific quirks—they want a clean picture of performance.
How to use AI for social media reporting
Getting useful reports out of AI comes down to how you set things up on the front end. Connect the right profiles, choose the right report types, and let the platform do the heavy lifting.
Vista Social has built its reporting suite specifically around this, with multiple report types, automated scheduling, AI-generated summaries, and conversational data access through its MCP integration.
Here’s how each piece of that fits together.
1. Start with smarter data collection
The quality of everything downstream depends on what data you connect at the start. Before you get to analysis, that means linking all your relevant profiles in one place and being intentional about which metrics actually matter for each account’s goals.
A brand awareness campaign and a lead generation push have different success criteria. For example, impressions are meaningful for one and largely irrelevant for the other.
Getting that filter in place upfront means your reports will contain numbers people can act on, rather than a wall of metrics that gives the impression of rigor without actually helping anyone decide anything.
Vista Social connects profiles across 13+ social networks from a single dashboard. All of it flows into one place, which means your cross-platform analysis starts from unified data rather than five separate exports.
The platform also backfills historical data when you first connect a profile, so your first report doesn’t start from zero.
2. Choose the right report type for the question(s) you’re trying to answer
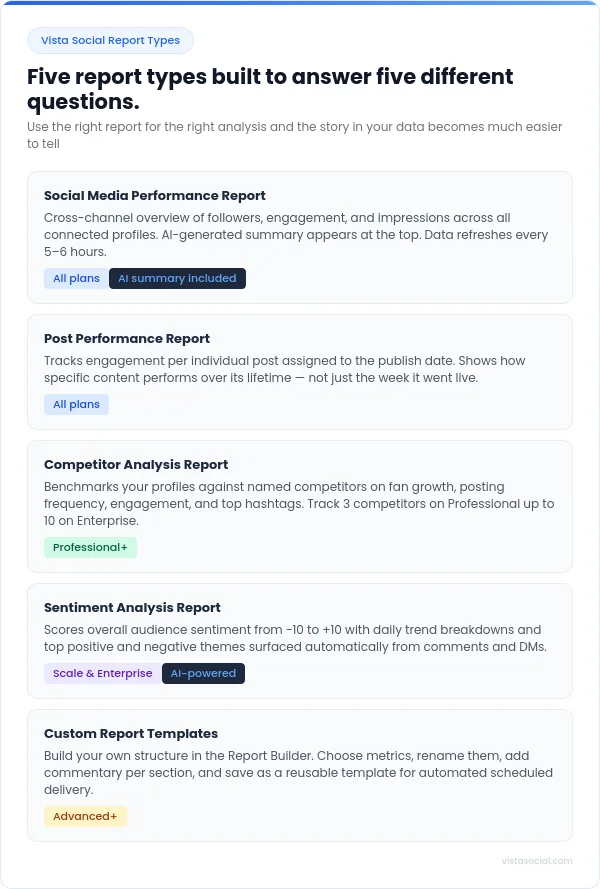
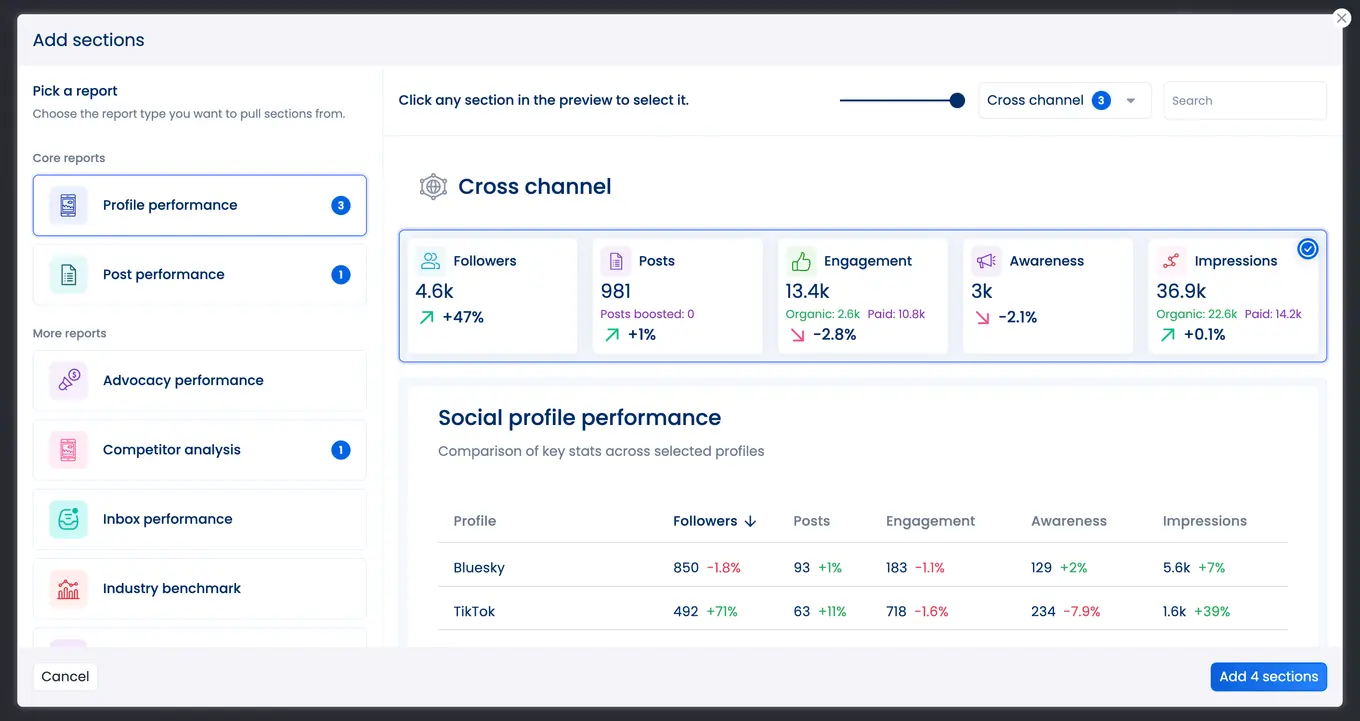
One thing that catches a lot of social media managers off guard is using a single report type for every question. Vista Social offers several distinct report types, and each one is built for a different layer of analysis.
Profile performance report
Your profile performance report can give you a cross-channel overview or dive into a single, specified channel’s performance.
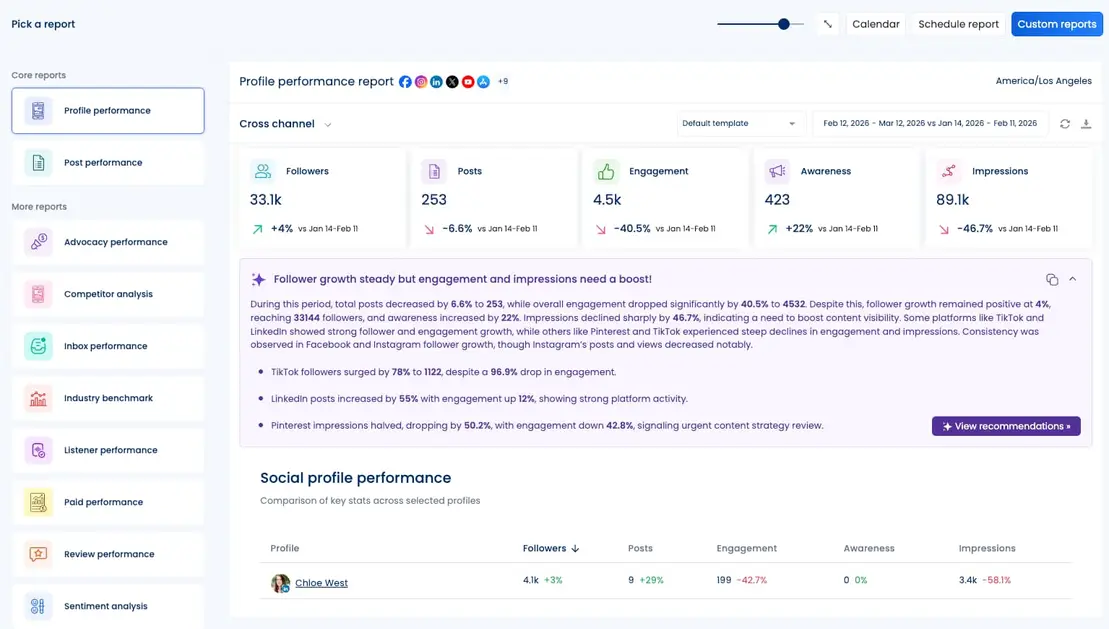
If you choose cross-channel insights, you’ll see a top-level view of followers, engagement, impressions, and post activity across all connected profiles. Plus, an AI-generated summary appears at the top of this report and gives you a plain-language interpretation of the data for the selected date range. Data refreshes every 5-6 hours so your numbers stay current.
Post performance report
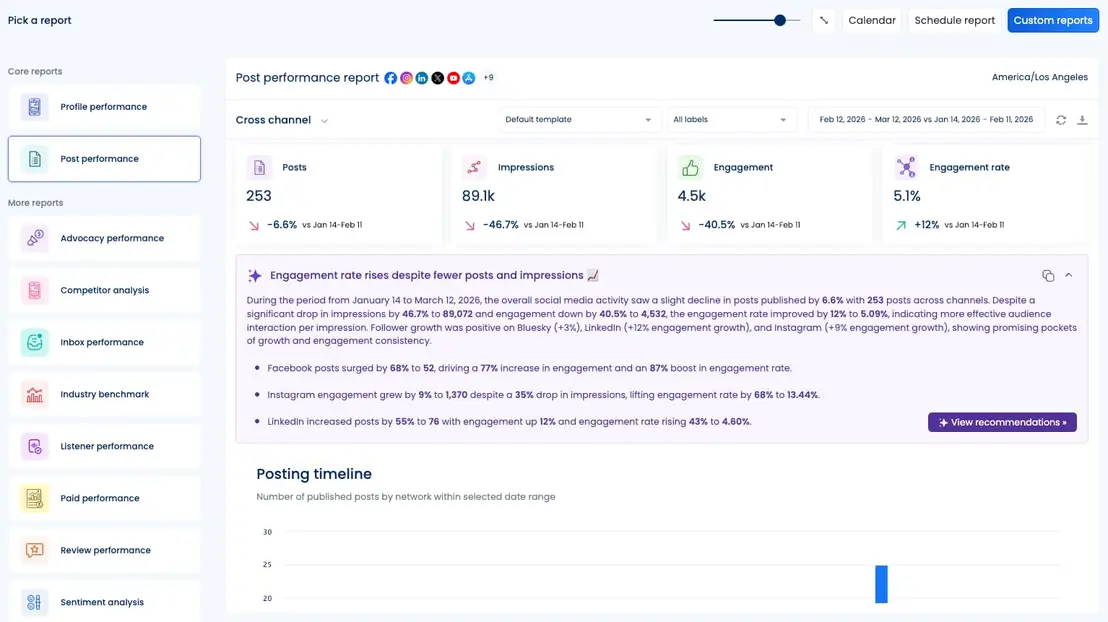
This one goes deeper into individual content, and can again explore posts across platforms or zone in on a single channel. It tracks engagement assigned to the post’s original publish date, which makes it useful for understanding how specific pieces of content performed over time, not just in the week they went live.
Competitor analysis report
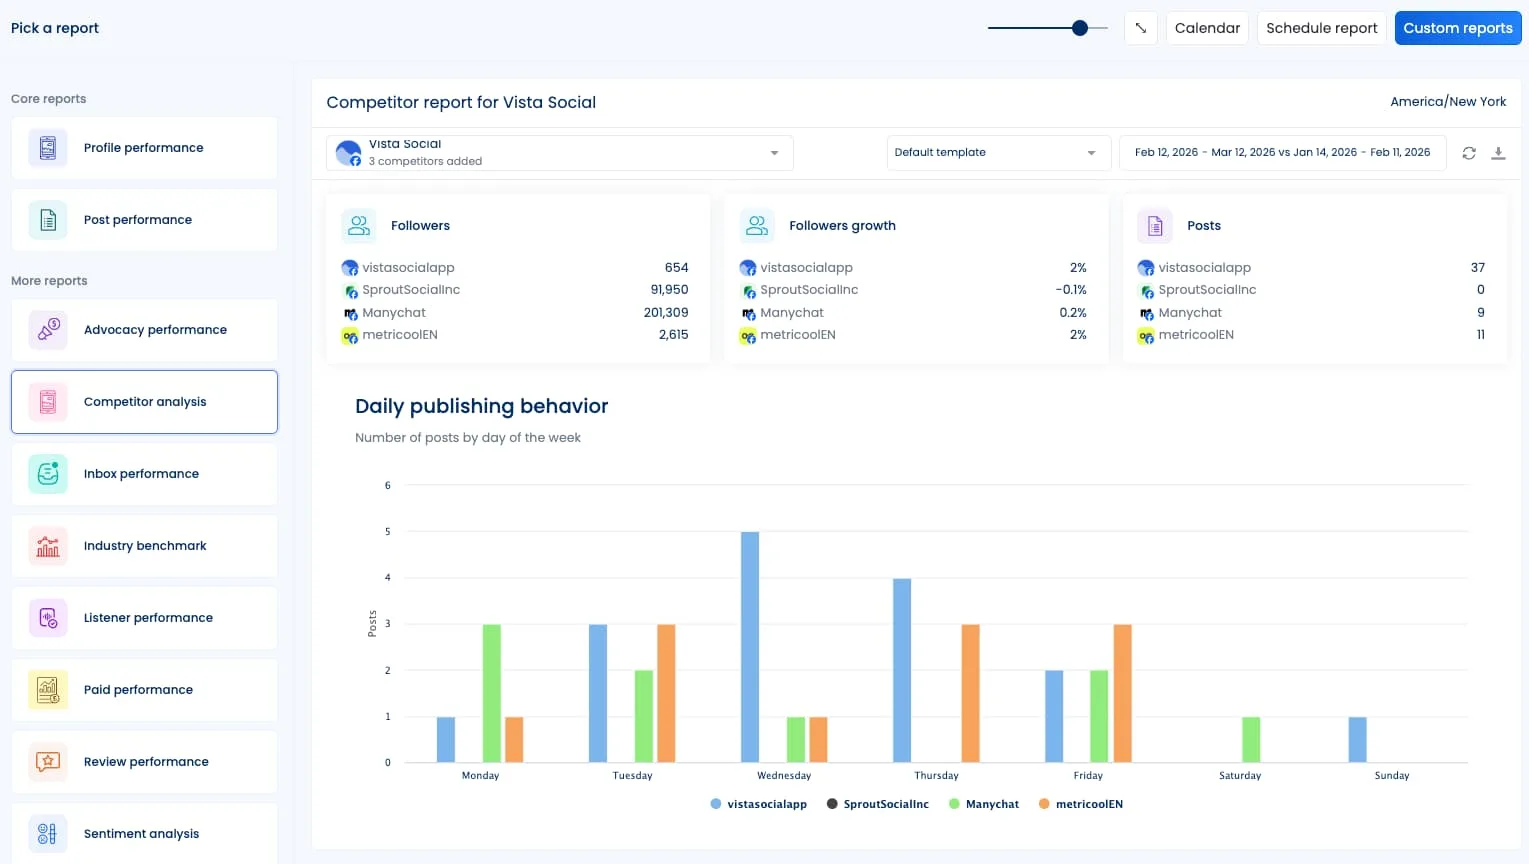
Benchmark your profiles against named competitor accounts on follower growth, posting frequency, engagement, and top-performing hashtags. Available across Professional through Enterprise plans, with the number of competitors you can track scaling with your plan. Currently only Facebook and Instagram are supported for this report.
Sentiment analysis report
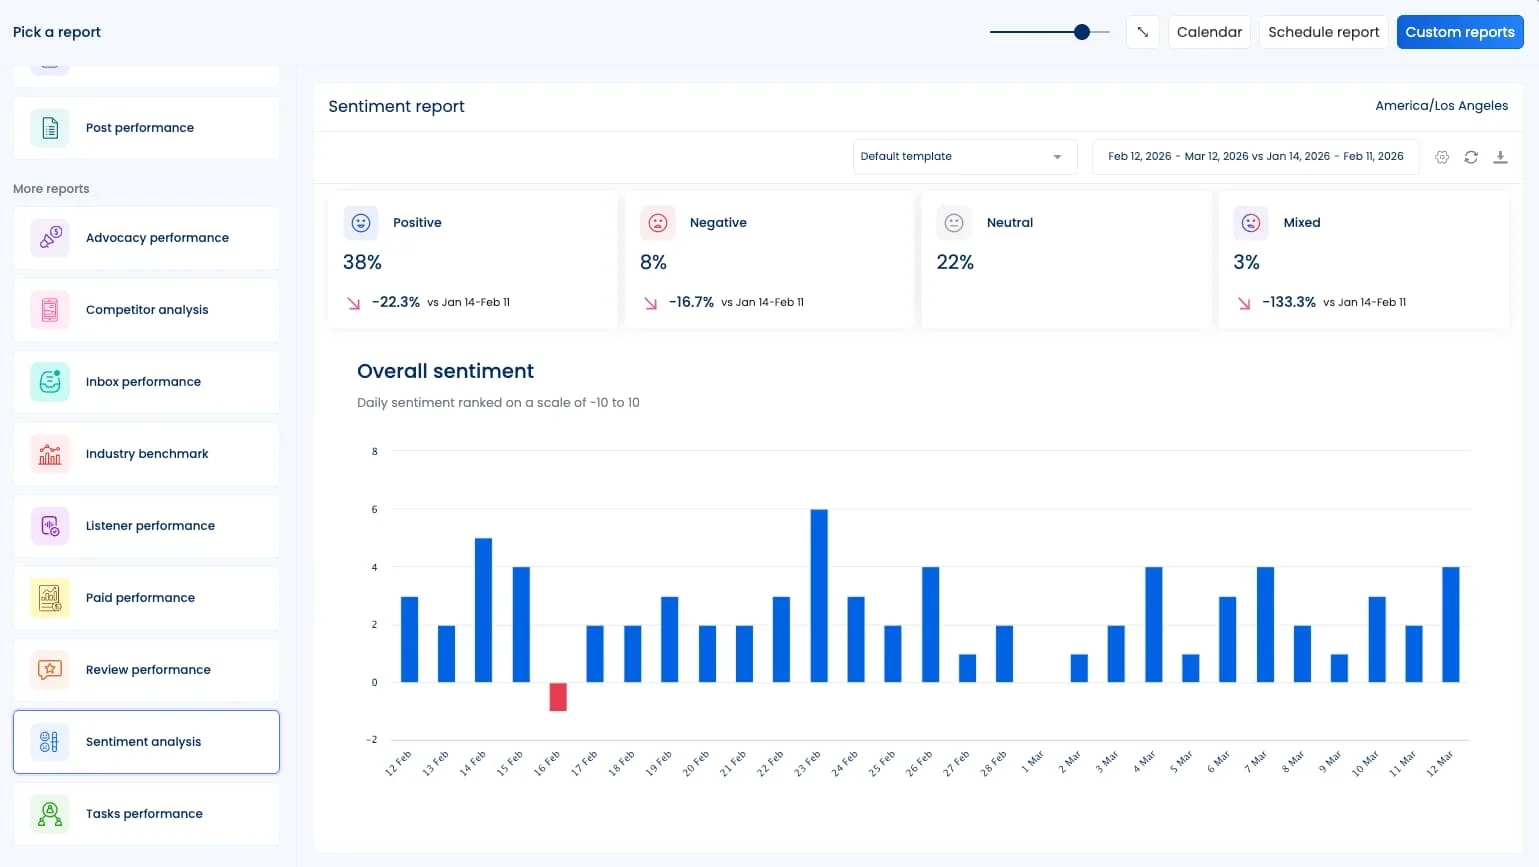
Track audience emotions across comments, DMs, and interactions, scoring overall sentiment on a scale from -10 to 10 and showing daily sentiment trends. Available on Scale and Enterprise plans.
Custom reports
Build your own report structure in the Report Builder by choosing which metrics to include, adding your own explanatory text per section, renaming metrics to match your organization’s terminology, and saving the template for reuse.
3. Let AI handle the first pass on analysis
Once your data is flowing in, AI handles pattern detection automatically. This includes spotting spikes and dips relative to your baseline, tagging high and low-performing content, and flagging when something is behaving differently than usual. You’re not hunting for the story. Instead, it comes to you.
Vista Social’s AI summary feature generates a plain-language performance overview automatically when you run a cross-channel profile performance report.
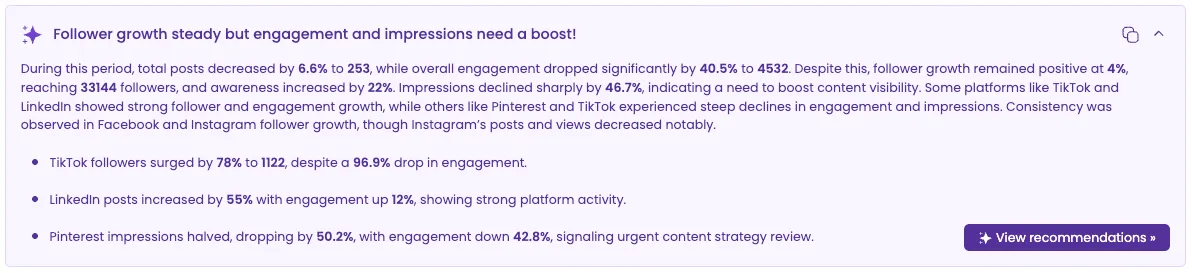
Instead of starting every reporting cycle with a blank document and raw data, you start with a summary you can review and then build on. The AI summary is toggleable, so if you want to run a report without it for a specific use case, that’s also an option.
Vista Social also sends weekly and monthly performance email notifications with AI insights built in, so you’re getting a high-level performance read every Monday without having to log in and pull a report manually.
4. Translate data into something stakeholders understand
Most social media managers know what happened in the data. The harder job is explaining what it means to someone who doesn’t live inside the reporting dashboard every day. It becomes infinitely harder under time pressure, and especially when the numbers tell a complicated story.
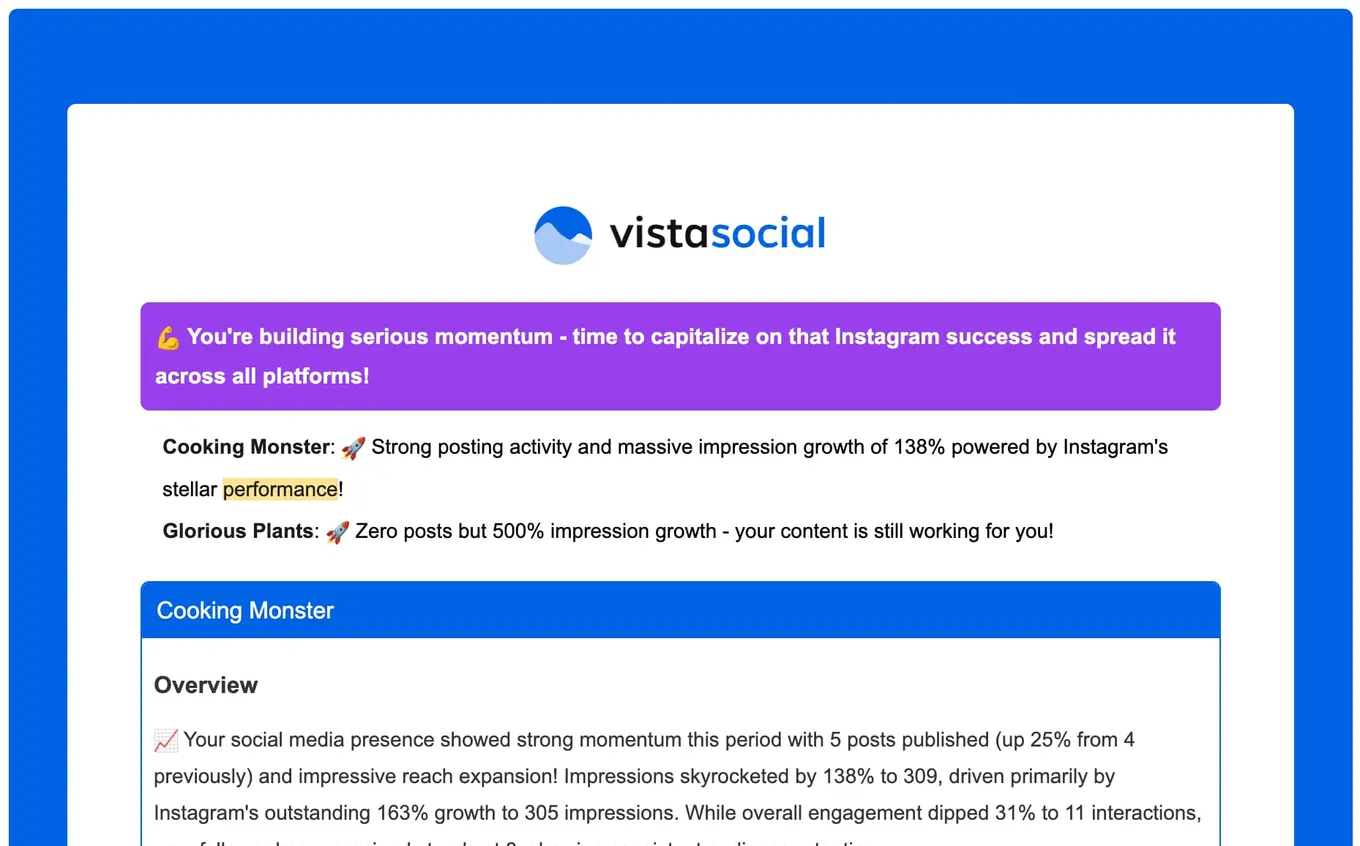
AI summaries handle that translation layer automatically. When Vista Social generates a report summary, it reframes the data in terms of outcomes rather than metrics. Engagement rate shifts become statements about audience behavior. Reach growth gets connected to content decisions you made. The output reads like something a person wrote.
This matters most when you’re presenting to leadership or clients who need to make a budget or strategy decision based on what the report says. An AI summary gets them to the point faster, which means fewer follow-up questions about what the numbers mean and more conversation about what to do next.
For agencies, the white-label reporting feature makes this even more useful. Every report goes out with your agency’s branding, not Vista Social’s. Clients see a polished, professional document that looks like your team built it from scratch because your team set up the template, defined the metrics, and added the custom commentary that connects the data to their business goals.
5. Build and schedule reports faster with templates
Different audiences need different reports. An internal team review looks different from a client-facing monthly deck, and a board-level summary looks different from both.
Vista Social’s custom reporting lets you build distinct templates for each scenario in the Report Builder, choose which metrics go in, add a cover page, rename metrics to match your organization’s language, and save the template for repeated use.
From there, you can run reports on demand or schedule them to generate and deliver automatically at a set date and time. Reports export as a PDF sent to your email, a shareable link, or a CSV file depending on what your audience needs. For agencies running monthly client reports at scale, that automated delivery loop eliminates a recurring manual task entirely.
6. Pull insights conversationally through AI integrations
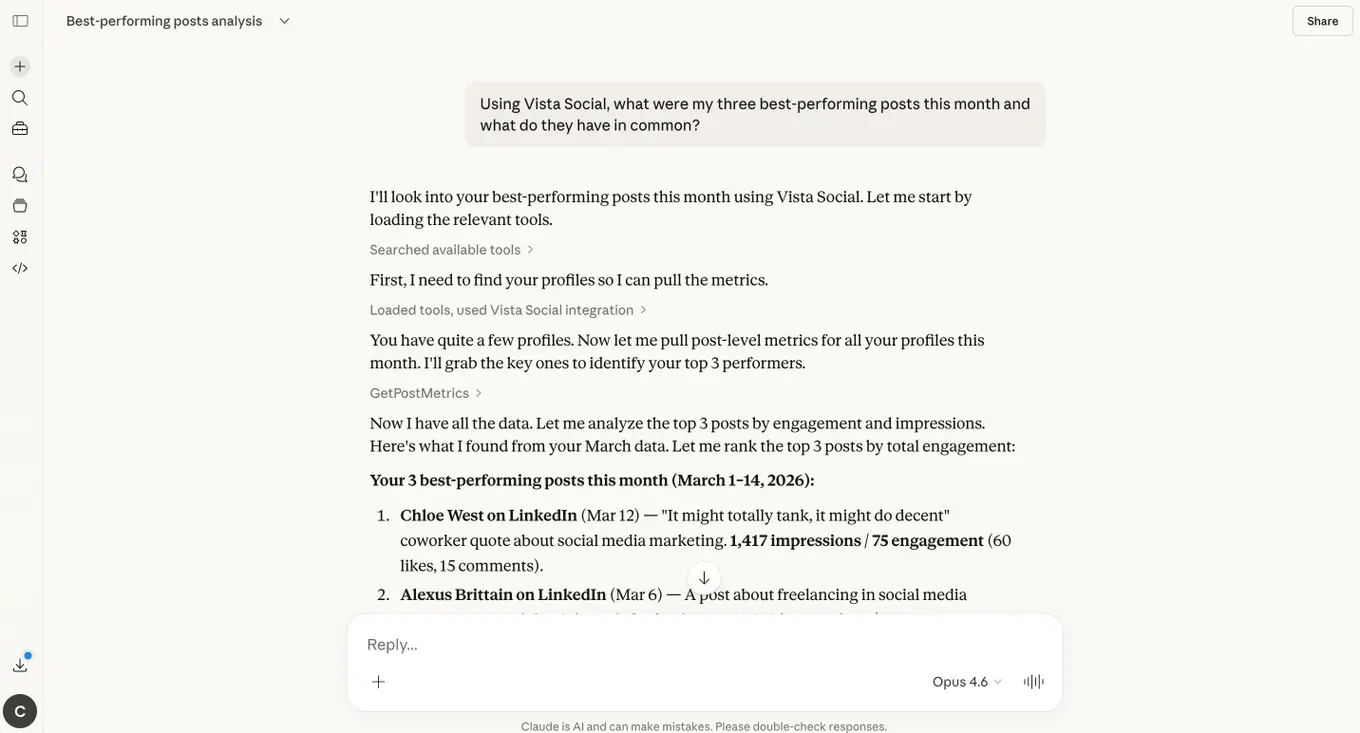
This is the feature that separates Vista Social from anything that came before it in reporting. Vista Social’s MCP integration connects your Vista Social data directly to AI tools like ChatGPT and Claude so you can ask questions about your own account performance and get real answers in natural language, in real time.
Most AI tools are trained on general knowledge, but they don’t know anything about your specific accounts. MCP solves that by teaching the AI what your Vista Social data structure looks like and what the platform can do. Once connected, the AI can access your actual account data and act on it, without you having to export anything or paste in a spreadsheet first.
In practice, this means you can type something like “What were my three best-performing posts this month and what do they have in common?” directly into Claude or ChatGPT and get an answer based on your real performance data.
Or you can ask “I have a product launch in two weeks, show me what’s currently scheduled around that date and flag any gaps.” The AI reviews your Vista Social calendar and responds with specific recommendations based on your actual content, not a generic best-practice response.
For reporting specifically, the MCP integration means you can run natural language queries across your analytics without switching tools, query performance trends across time periods, request instant summaries, and get data-informed content recommendations, all inside the AI interface you’re already working in.
Start reporting smarter with AI
AI doesn’t replace the social media manager’s judgment in the reporting process. What it replaces is the part of reporting that never required much judgment to begin with: pulling data from five platforms, normalizing it, formatting it into slides, and writing the same summary sentences you wrote last month.
According to the HubSpot 2026 State of Marketing Report, 33% of marketing professionals state that measuring marketing ROI is the number one challenge they face. That’s not a new problem, but it is a solvable one once you stop treating reporting as a manual task and start building it as an automated, ongoing output that doubles as a strategic roadmap.
Vista Social’s reporting suite, AI summaries, scheduled delivery, white-labeling, and MCP integration are built to get you there without adding another tool to manage.
Start your free 14-day trial and see what a month of smarter reporting looks like.
Try Vista Social for free
A social media management platform that actually helps you grow with easy-to-use content planning, scheduling, engagement and analytics tools.
Get Started NowAbout the Author

Content Writer
Orion loves to write content that refuses to be boring. As part of Vista Social, he helps brands, creators, and agencies stop doom scrolling and start winning with social media. When he's not in front of a keyboard, he's watching films in IMAX with his wife, dissecting football tactics (the European kind), and getting lost in a good book.
Loading related tools...


Tools
PublishingAnalyticsEngagementIntegrations
FacebookInstagramLinkedInRedditSnapchatThreadsTikTokX (Twitter)YouTubeBlueskyVista Page (link-in-bio)All IntegrationsCopyright © 2026 Vista Social LLC. All Rights Reserved.