

Published on August 13, 2026
10 min to read
Why Your Social Media Numbers Never Match

Summarize with AI

Table of contents
Summarize with AI

ChatGPT

Claude

Perplexity
Share

Vista Social

X (Twitter)


The first sign that a reporting dashboard has lost your trust often comes during a client call. You sent the report on Tuesday. Two days later, someone opens the same Instagram post and asks why their reach figure is higher than yours.
You say you’ll check it, and from then on you open the native app before every report. Social media analytics discrepancies cost you extra work and make you hedge around figures you should be able to explain.
Two figures can both be valid because the systems may use different definitions, time zones, date ranges, and refresh points. Some gaps are normal. Three deserve a closer look, and you can tell them apart without checking every row by hand.
There is no true number to find. Instagram describes reach as an estimate, so ask whether the gap between your sources holds still.
The short version
- Different can be valid: Two systems can disagree even when both are correct because their definitions, clocks, or settings differ.
- Reach is estimated: Instagram estimates how many unique accounts saw your content. Views records, plays, or displays and may count repeat views from the same account.
- April 2025 changed the series: Meta introduced views and removed older API metrics, which means charts can cross two measurement methods.
- Three failures need action: investigate data that never catches up, blended paid results, and missing values shown as zero.
Table of contents
Why can two systems both be right?
They can be right because they may be answering different questions. A card labeled “reach” can refer to unique accounts, while “views” can rise whenever content appears again. The numbers look comparable because both sit beside the same post, but their counting rules aren’t the same.
Instagram’s current insight definitions make this distinction clear. Views count how many times content was played or displayed. Accounts reached unique counts of accounts that saw it at least once, and Instagram labels reach as estimated and in development.
That word “estimated” matters. The platform has to remove repeat exposure from its reach count, a process called deduplication.
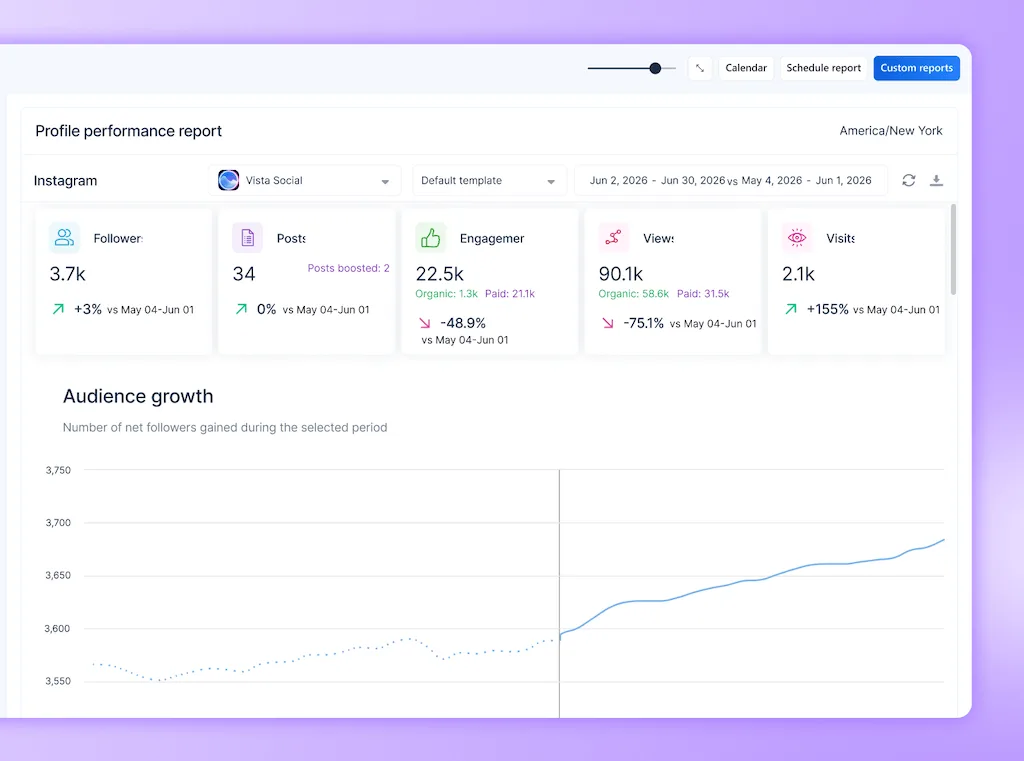
Two reporting surfaces can deduplicate at different times or over different windows. Because of that timing, they can produce two defensible estimates.
Reach vs impressions vs views
Use this table to check whether the two screens are even measuring the same event before you compare their totals.
| Metric | What it counts | Why another screen may differ |
|---|---|---|
| Reach | Unique accounts that saw the content at least once | It is estimated, and repeat exposure has to be removed from the count |
| Impressions | The number of times content entered a screen under the older Instagram API metric | Meta stopped returning it for newer Instagram media, so a current view may not have an equivalent figure |
| Views | Plays and on-screen displays of the content | The same account may contribute more than once, including a Reel replay |
Six reasons the numbers differ
- Metric definitions: Reach, views, impressions, plays, and engagement don’t count the same events. A shared label can also hide a network-specific definition.
- Date ranges: “Last seven days” and “Monday through Sunday” can include different hours. A post published near the boundary makes the mismatch easier to see.
- Time zones: A report may close the day in your profile group’s time zone while the native app uses another setting. Late-night activity then lands on different dates.
- Interface settings: Meta lets an API request specify its time range, fields, breakdowns, and attribution window. The screen already open in the app may use another preset.
- Refresh timing: The native app and a connected tool don’t update at the same moment. One can show activity that the other hasn’t collected yet.
- Metric changes: Platforms rename, replace, or stop returning metrics. A report has to mark the missing value clearly instead of pretending the old measure still exists.
Vista Social’s figures won’t match the native app exactly either. We collect the values supplied through network APIs and refresh them on a schedule. The native screen may use a newer pull or a different view when you compare them.
That admission doesn’t excuse every gap. First confirm the metric, reporting period, time zone, paid status, and last refresh.
How long should data take to settle?
Recent social data can move while new activity arrives and platforms revise earlier totals. A connected tool also needs time to request the new value, so the dashboard may trail the app for a few hours.
Vista Social’s current data schedule says Instagram profile and post metrics refresh every five to six hours. Our report definitions say Meta may adjust engagement for up to 30 days. Some retroactive changes don’t reach third parties.
There isn’t one settlement window that applies to every network and metric. Use the same post as a control and record both figures after 24 hours, 72 hours, and seven days. This is a practical test rather than a promise about when a platform must finish updating.
If the figures move and then hold in roughly the same relationship, refresh timing or methodology is the likely cause. If the dashboard stays behind, send support the post URL and exact reporting settings. Include two timestamped screenshots, which gives the team something specific to investigate.
What changed in Instagram reporting in April 2025?
You might have seen a sudden increase in your Instagram reporting around April 2025 and not known why at the time. The change may have had little to do with performance. Meta updated the metrics available to reporting tools, which left some historical charts placing older impressions data beside newer views data.
Meta released Graph API v22.0 on January 21, 2025 and introduced views to Instagram insights. According to its official API changelog, Meta removed impressions and plays from that API version. The change then applied to every API version on April 21, 2025.
Meta also stated that impressions requests made on or after April 21 for media created on or after July 2, 2024 would return an error. Reporting tools could no longer use impressions as a like-for-like measure for newer Instagram posts.
Views became the main measure for content that was played or displayed. On Reels, one account can add several views by watching more than once, while reach counts that account once. That change could make reported totals look higher after April 2025 even when the audience hadn’t suddenly grown.
Mark April 21 as a change in measurement on any chart that crosses that date. Don’t calculate one growth percentage across the old impressions data and the newer views data. The history can stay, but the reader needs to see that the unit changed.
The API change also left some impressions fields unavailable. If a dashboard fills one of those fields with 0, the report says the post received no impressions. “Unavailable” correctly tells the reader that the platform didn’t return a measurement.
What is actually broken?
Normal variance has a reason you can name and a behavior you can observe. These three problems interfere with the decision the report is meant to support.
- Late data: Compare the last refresh with the tool’s published schedule before opening a ticket.
- Blended results: Check whether paid and organic distribution can be viewed separately.
- Missing values: Look for a clear “unavailable” label because a zero should represent measured performance.
1. Data never catches up
A report may trail the app between refreshes. It becomes a defect when the delay continues past the tool’s stated schedule, the gap keeps widening, or old posts change without a matching update from the platform.
Check three to five posts rather than the single post that started the argument. Record the same metric on the same dates, then send the comparison to support. That recurring pattern gives support more to work with than “the numbers look off.”
2. Paid and organic results are blended
A boosted post can earn distribution from the original organic post and the paid campaign attached to it. A combined figure can show total exposure, but it can’t prove organic performance. You need separate paid and organic values for that claim.
The consequence is easy to miss in a deck. Media spend can make a creative idea appear to have driven a jump in organic reach. The next content plan then repeats the wrong lesson.
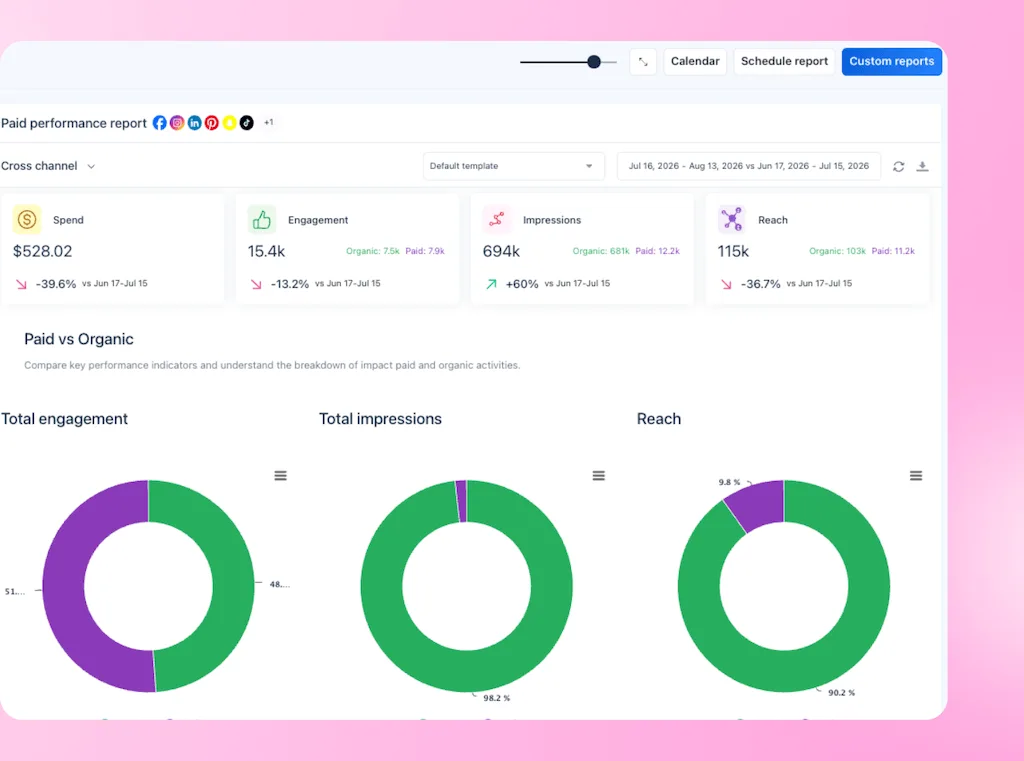
Ask your reporting tool to show paid and organic reach, impressions, and engagement separately. Connect the relevant ad account, and Vista Social’s paid reporting will show that split.
3. Missing data appears as zero
Zero means the platform returned a measurement and nothing happened. Unavailable means the platform didn’t return that metric for the post, account, date, or API version.
Turning both states into 0 can make strong content look like it failed. It can also drag down the report’s averages.
Measurement specialist Aleyda Solis made the same distinction while writing about AI search. In that field, observed data, estimates, and indirect signals often get blended. Her warning also fits a social report that gives every field equal confidence.
“The single most common reporting failure in AI search measurement is collapsing direct evidence, directional proxies, and modeled estimates into one undifferentiated ‘AI impact’ number.”
Aleyda Solis, Measurement framework
Your report should distinguish a direct count, an estimated metric, and an unavailable field. That small label prevents a missing value from becoming a false performance claim.
How do you tell a normal gap from a broken one?
Run the same three checks whenever social media data doesn’t match the native app. Use several posts over a few weeks, since a single post can be affected by one late refresh.
- Does the gap stay stable?: Record whether the dashboard is higher or lower and by roughly how much. A gap that keeps the same direction and a similar proportion points toward a consistent definition or capture method.
- Do the figures converge?: Compare them after the tool’s documented refresh cycle and again when the post is older. A number that never catches up deserves investigation.
- Can you explain the difference?: Name the definition, date range, time zone, paid split, refresh point, or metric change responsible. “The tool is usually lower” isn’t enough on its own.
Passing all three checks points toward a methodology difference. Failing one gives you a precise reason to escalate, along with the evidence and support needs to reproduce it.
The test can guide your next check but cannot prove the data is sound. A stable gap may still hide a consistent calculation error, so keep one controlled spot check each month.
So what should you actually report?
Pick one reporting source for each metric and keep using it. A consistent series lets you compare this month with last month, even when the absolute number is an estimate. Switching between the highest available figure each cycle creates a trend line that can’t be compared with itself.
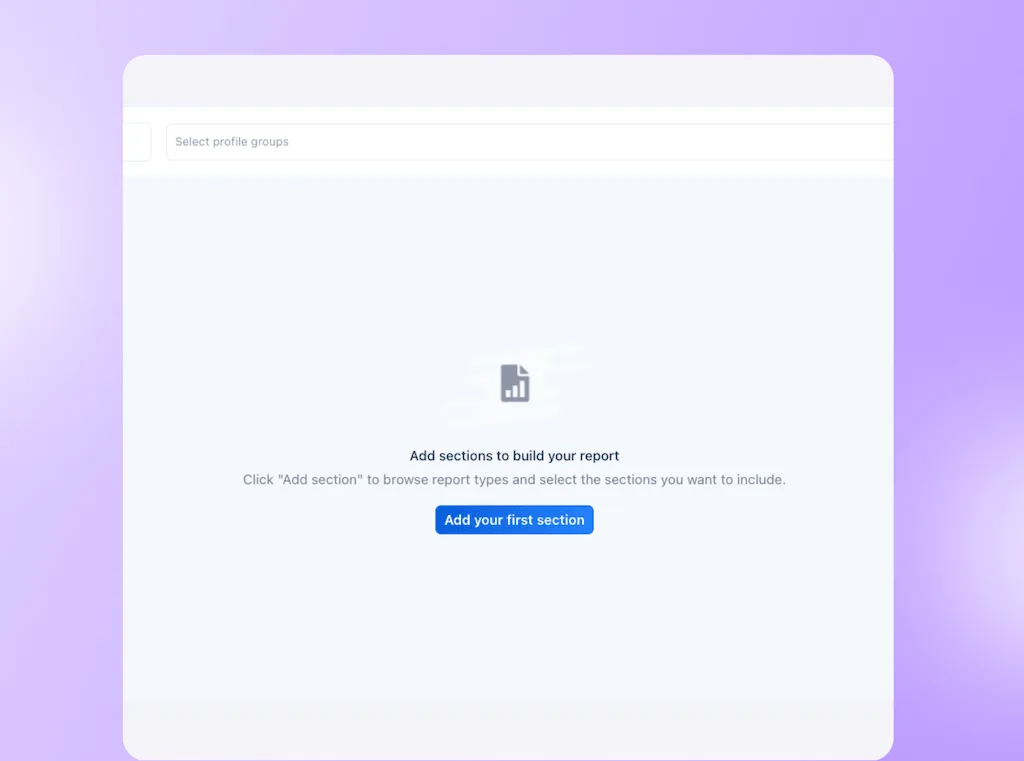
Write the source and definition into the template the first time. Vista Social’s custom reports let you choose sections and add explanatory text. For example, “Instagram accounts reached through the API” can travel with the chart.
Give every metric a reporting rule
| Decision | What to record | Example |
|---|---|---|
| Metric source | The system used for the published figure | Vista Social Post Performance Report |
| Definition | What the number includes | Unique accounts reached, estimated by Instagram |
| Reporting window | Date range and time zone | Calendar month in the profile group’s time zone |
| Paid treatment | Whether paid results are excluded, included, or split | Paid and organic shown separately |
| Control check | The post and date used for a monthly comparison | One published Reel checked seven days after posting |
The reporting tool is accountable for a consistent method, a clear refresh schedule, and a clean paid-versus-organic split. It should also show missing data as unavailable. No tool can turn an estimated platform metric into an exact head count.
AI can help with the explanation after those rules are set. In Vista Social, you ask for the summary when you need it; it doesn’t monitor or validate every account automatically. The summary can point out changes and patterns, but it can’t validate a number the platform didn’t provide.
Choosing one source creates a consistent reporting series. It doesn’t certify universal correctness, while the note beside the metric tells your client or director how to read it.
Frequently asked questions
How big a discrepancy is acceptable?
There is no universal percentage that makes a discrepancy safe. Check its direction and rough proportion, then see whether it catches up within the documented refresh cycle and has a definition you can explain. A smaller unexplained gap can deserve more attention than a larger one with a clear cause.
Which number should I put in a client report?
Choose one source for each metric, name it in the report, and keep using it. The same method across reporting periods makes the trend comparable, while picking whichever source is highest each month does not.
Why did my numbers go up around April 2025?
Instagram’s API metric set changed in April 2025 when views took the place of older reporting measures. A chart that joins the periods crosses two measurement methods, so label the break before comparing them.
Does a boosted post show up in organic reporting?
A boosted post can have both paid and organic activity attached to the same content. Separate those results before you describe a figure as organic because a client may use it to judge the creative work.
Is it normal for analytics to be a day or two behind?
Some delay can happen because a connected tool refreshes on a schedule and platforms may adjust recent data. Compare the figure with the tool’s published refresh timing. If the report remains behind, send support screenshots and the exact settings.
Does exporting the data and checking it myself help?
An export can confirm what the tool received and is useful during an investigation. For routine reporting, one monthly post check gives you a cleaner signal without rebuilding the full report by hand.
Should I expect my tool to match the native app exactly?
No. Platform estimates, API settings, refresh timing, and interface defaults can all produce a stable difference. Expect the tool to explain its method, refresh on schedule, separate paid from organic results, and display unavailable data honestly.
Try Vista Social for free
A social media management platform that actually helps you grow with easy-to-use content planning, scheduling, engagement and analytics tools.
Get Started NowAbout the Author

Content Writer
Orion loves to write content that refuses to be boring. As part of Vista Social, he helps brands, creators, and agencies stop doom scrolling and start winning with social media. When he's not in front of a keyboard, he's watching films in IMAX with his wife, dissecting football tactics (the European kind), and getting lost in a good book.
Loading related tools...

The most complete social media management platform for teams who demand more.






Tools
PublishingAnalyticsEngagementIntegrations
FacebookInstagramLinkedInRedditSnapchatThreadsTikTokX (Twitter)YouTubeMCPVista Page (link-in-bio)All IntegrationsCopyright © 2026 Vista Social LLC. All Rights Reserved.